Mandates Without Megawatts
Governments from Conakry to Lilongwe are ordering miners to process at home. A smelter needs about 500 MW of firm power, and the record shows the decision that matters is who owns that power and the capital behind it.
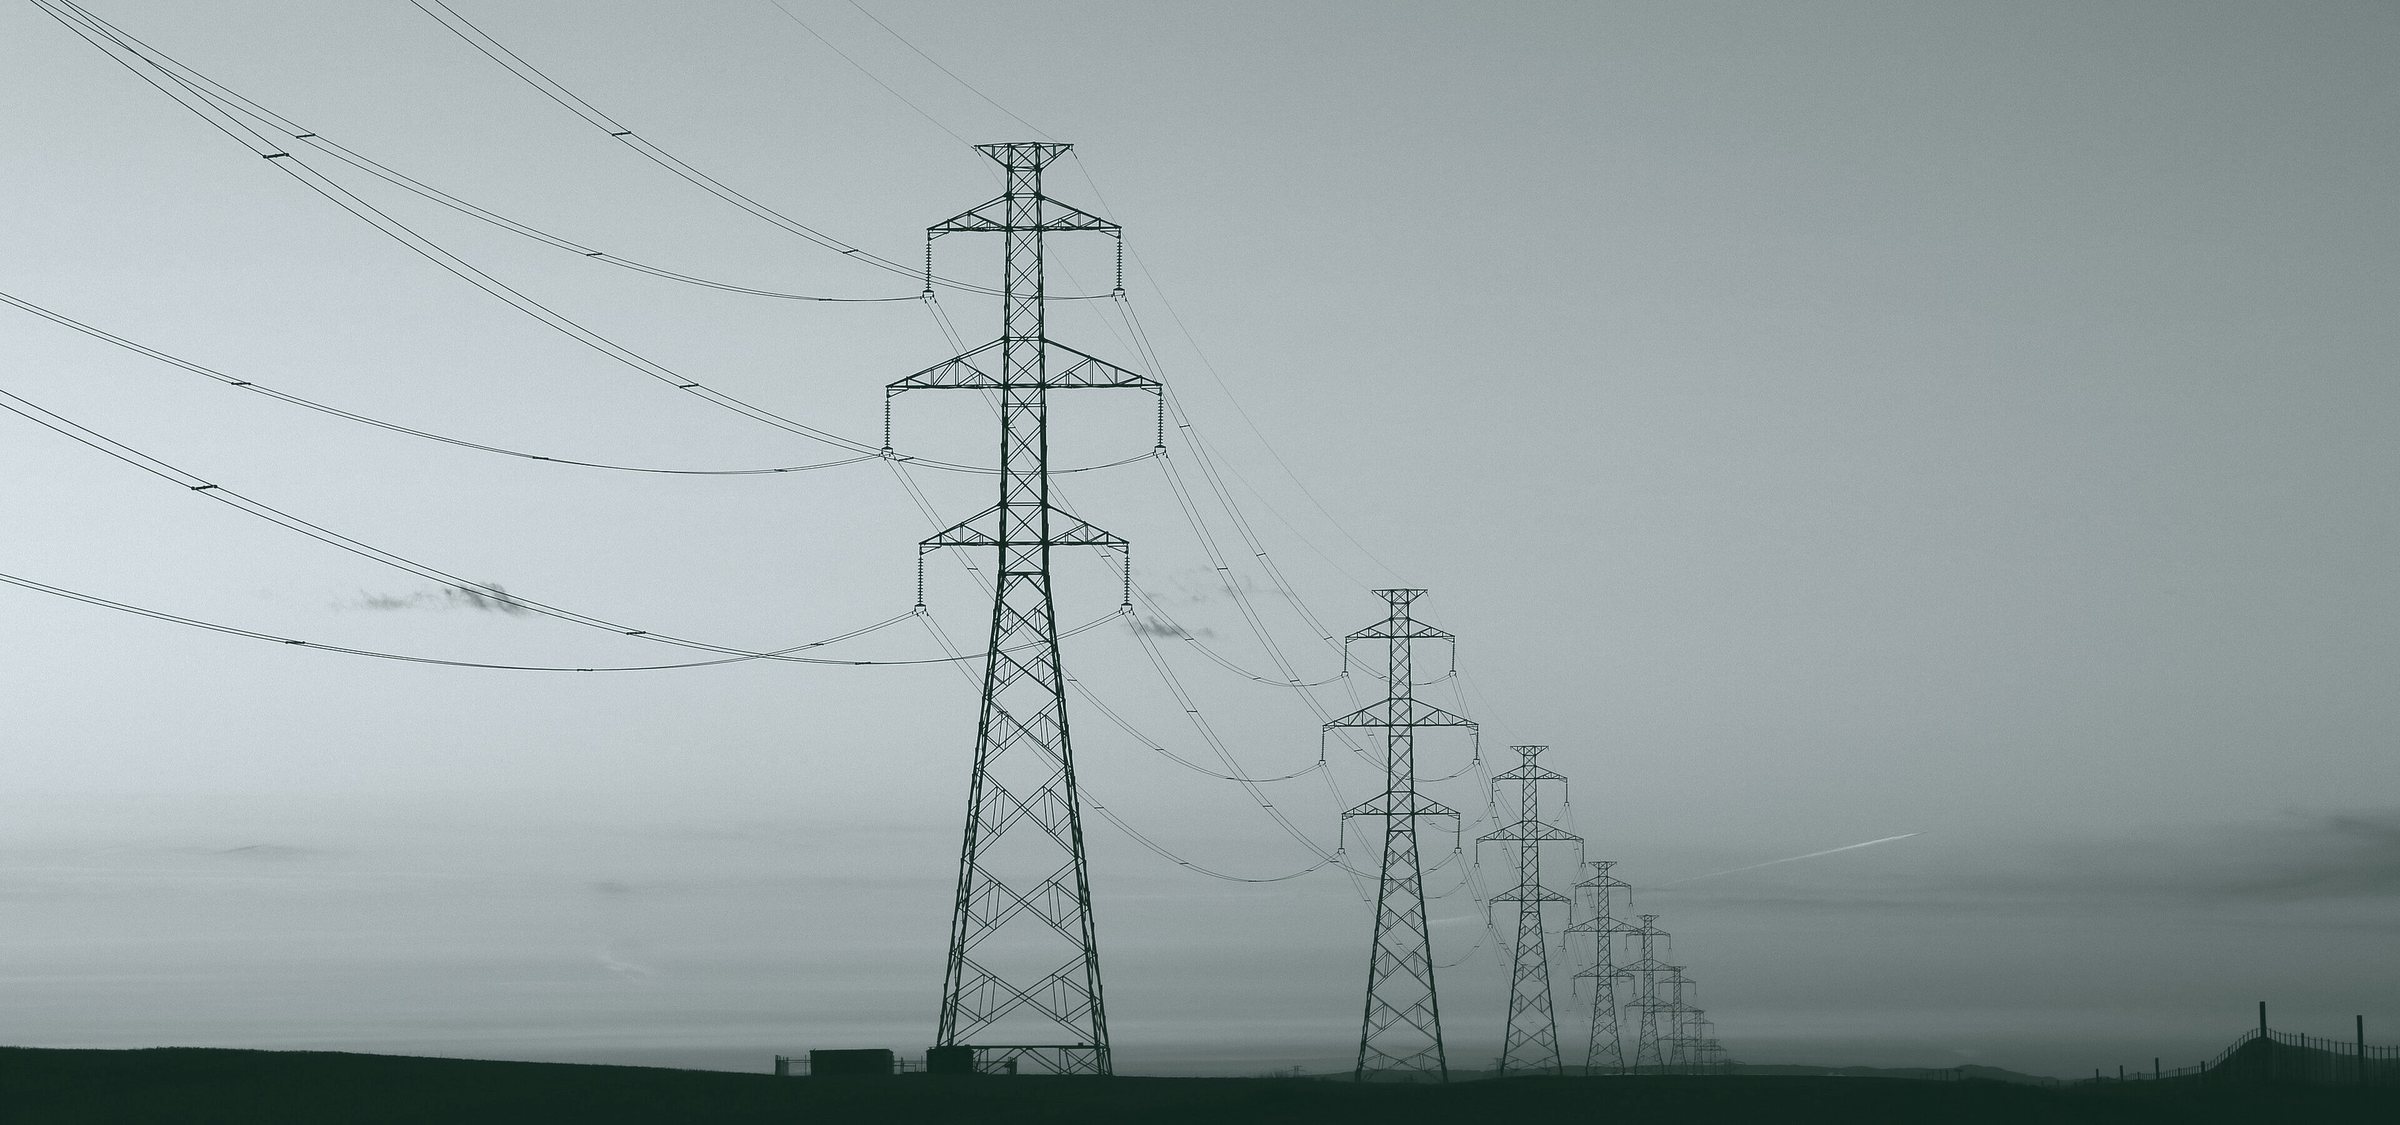
Governments are ordering their miners to process at home faster than anyone can build the power plants to do it.
- ~500 MWof firm, non-interruptible power: the minimum a single smelter needs, according to a June 2026 feasibility study by CRU for the World Bank1
- One-fifthof Mozambique’s exports, and about 2 per cent of its GDP, went into care and maintenance with the Mozal smelter on 15 March 20262
- 7 to 10 timesthe nameplate capacity of Guinea’s new gold refinery against the country’s 2025 gold output, on our calculation3
- 0of the 11 mineral and energy exporters we ranked improved their economic-complexity position between 2015 and 2024, on 2015 ranks we derived; Indonesia, the model downstreamer, fell 9 places4
One-fifth of exports, switched off
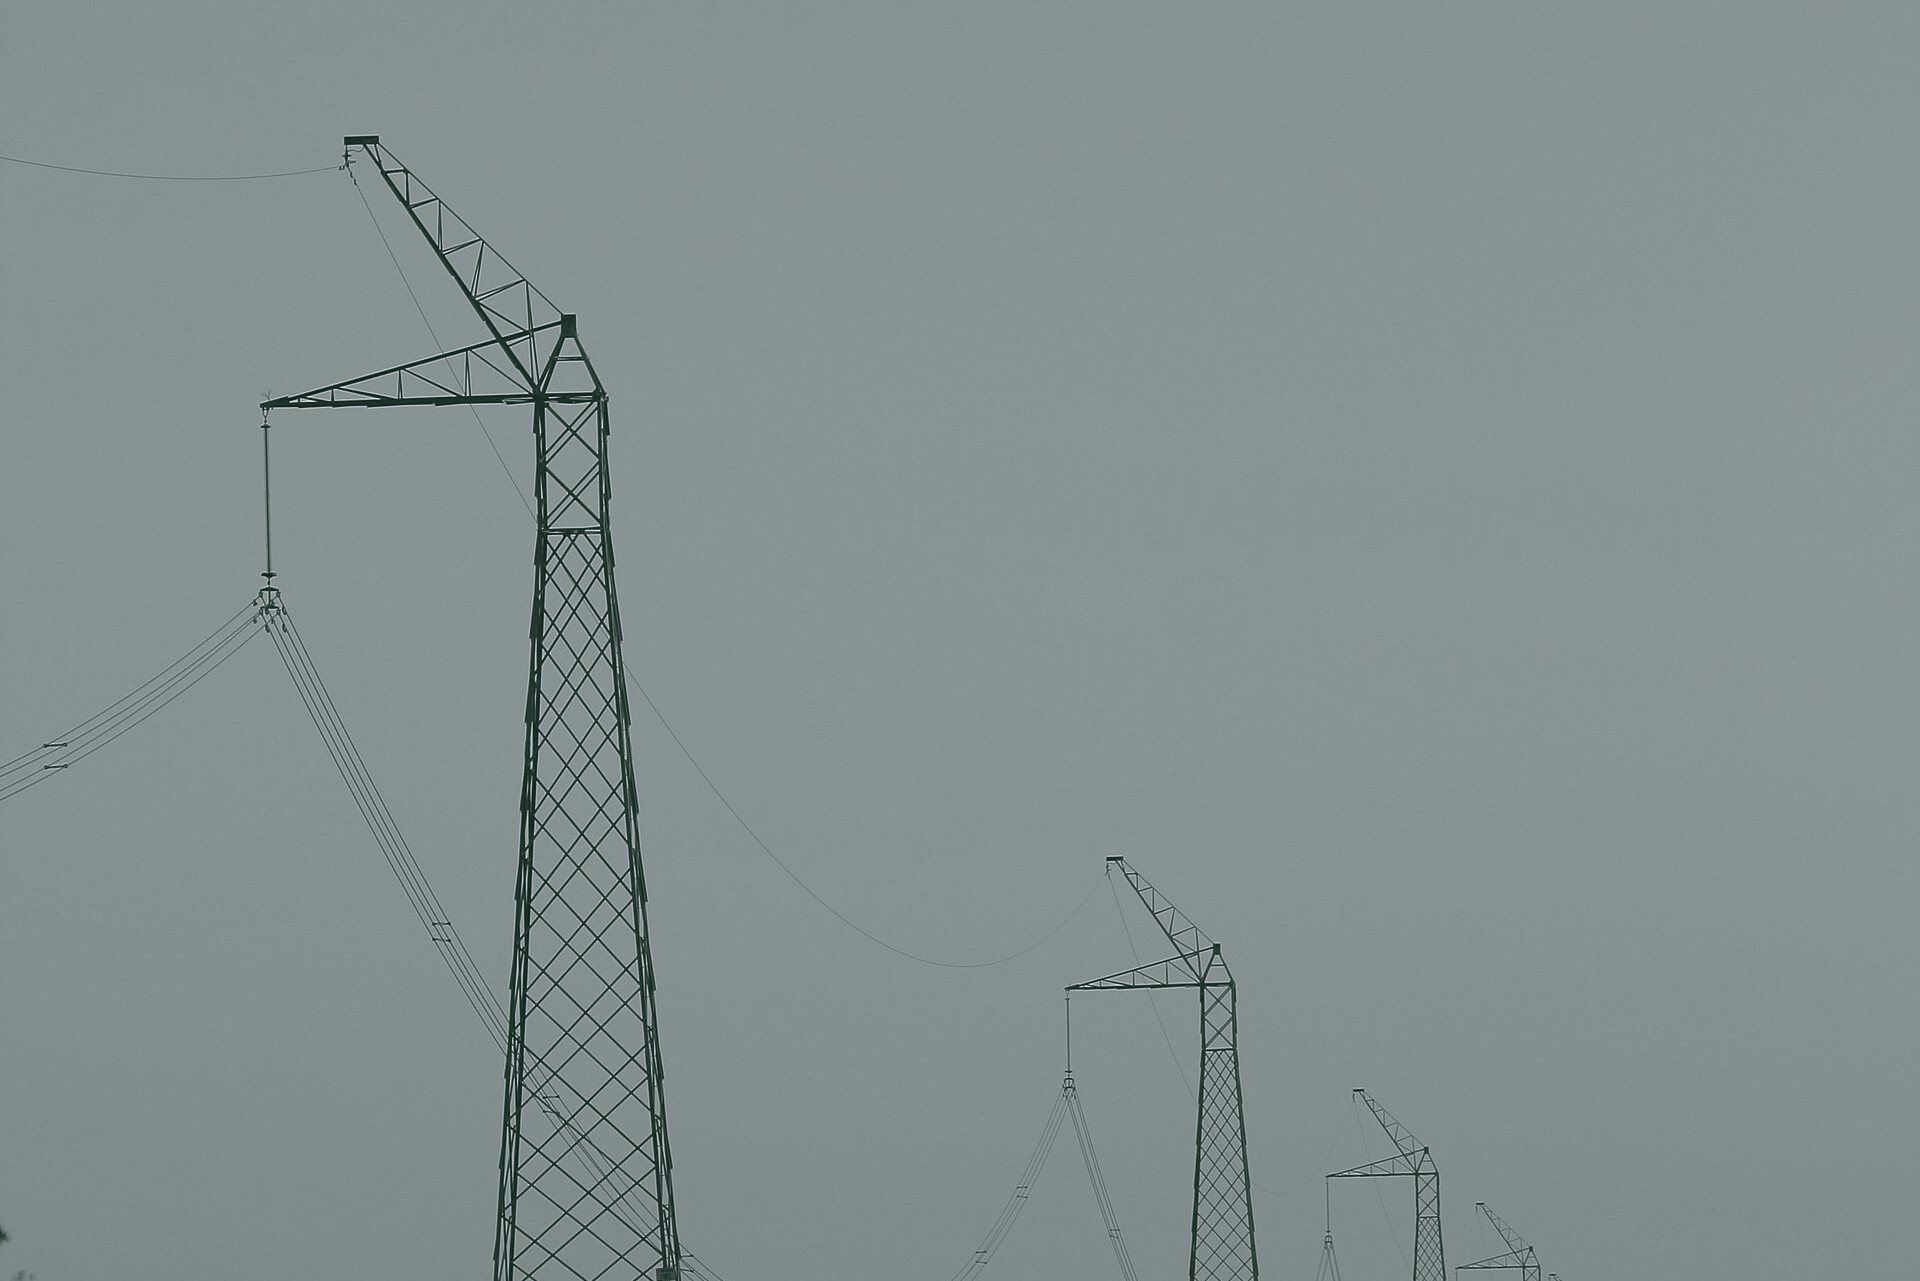
On 15 March 2026 South32 placed the Mozal aluminium smelter in Mozambique on care and maintenance. After six years of talks with the government, the company said it was unable to secure “sufficient and affordable power supply for Mozal beyond March 2026”.5 Mozal was financed with International Finance Corporation support under an agreement signed on 30 June 1998, at an estimated cost of US$1.3bn.6 It made metal from imported alumina, and its binding input was electricity.
The International Monetary Fund had put “a major aluminum producer”, which can only be Mozal, at about 2 per cent of Mozambique’s GDP and one-fifth of its exports, in an Article IV report its board considered on 13 February.2 South32 owns 63.7 per cent of Mozal, South Africa’s Industrial Development Corporation 32.4 per cent and the Government of Mozambique 3.9 per cent. Keeping the idle plant costs about US$5m a year on a 100 per cent basis, according to the company.5
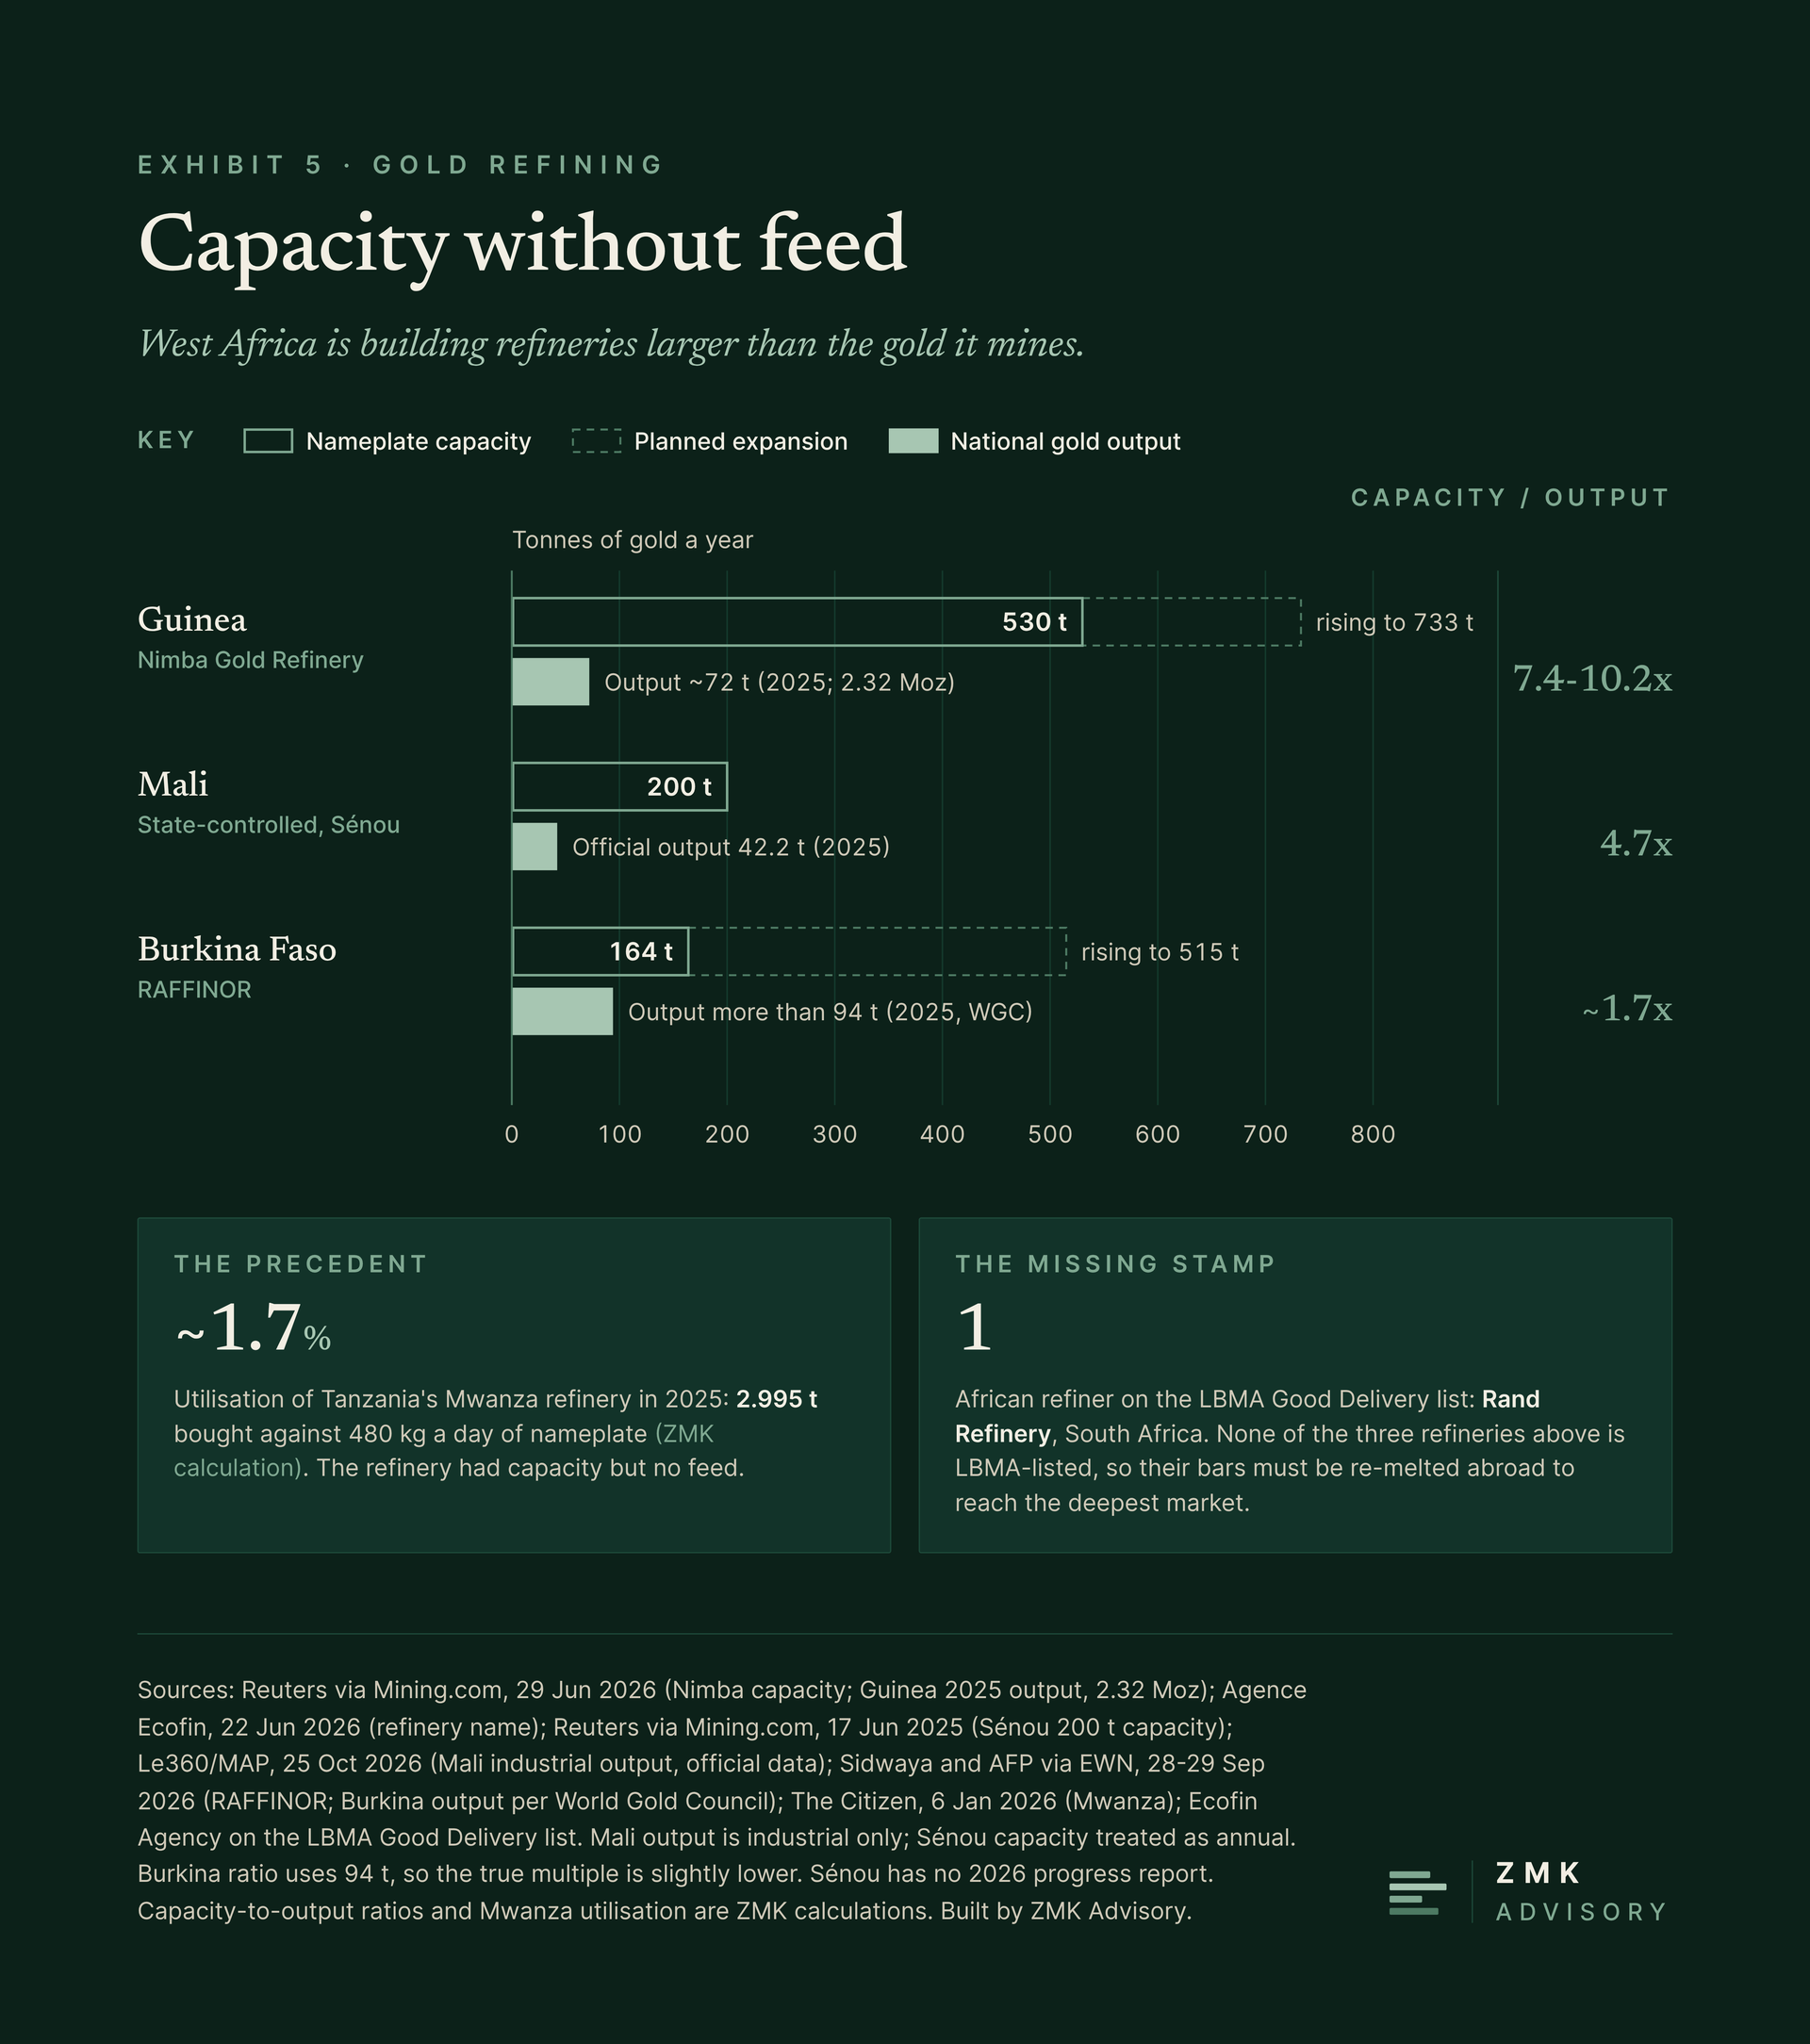
Meanwhile the mandates multiplied. Guinea’s president announced the end of raw gold exports on 19 June, with the metal to be refined at the Nimba Gold Refinery being installed in Conakry.7 A decree of 3 July regulating the gold sector was replaced on 8 July by one requiring exports as certified refined bars.8 The refinery, a US$30m public-private partnership, has a nameplate of 530 tonnes a year rising to 733 tonnes. On our calculation that is 7.4 to 10.2 times Guinea’s 2025 gold output of about 72 tonnes.3 The Democratic Republic of Congo suspended cobalt exports in February 20259 and replaced the suspension with a 2026 quota of 96,600 tonnes of contained cobalt.10 Zimbabwe expects a ban on lithium concentrate exports to take effect in January 2027.11 Malawi banned raw exports of 16 minerals by executive order in October 2025, and its Department of Mining then collected 89 per cent less than budgeted.12
The engineering moves at a different speed. The World Bank study sets the floor for a smelter at about 500 MW of “firm, non-interruptible, ideally low-carbon power”, supplied on bankable long-term terms.1 Aluminium smelting consumes 13 to 15 MWh per tonne. New smelting capacity outside China costs “around $2000/t” with a Chinese partner and “at least $3000/t” without one. The authors warn that “it is easy to lock in uneconomic assets if decisions are driven purely by ‘value addition’ imperatives rather than rigorous economics”.
The record reviewed below points to one rule. A processing mandate creates value only where the country supplies four conditions together: firm cheap power, secure feedstock, capital with export-market access, and disciplined governance. Where they are missing, the rent moves to whoever owns the power and the capital, usually a foreign investor, or the mandate ends with a state utility that cannot deliver. This is our judgement, based on our register of 39 instruments and the record of 39 processing cases. For a minister, the 500 MW comes before the decree.
The 2026 wave: most mandates make nothing
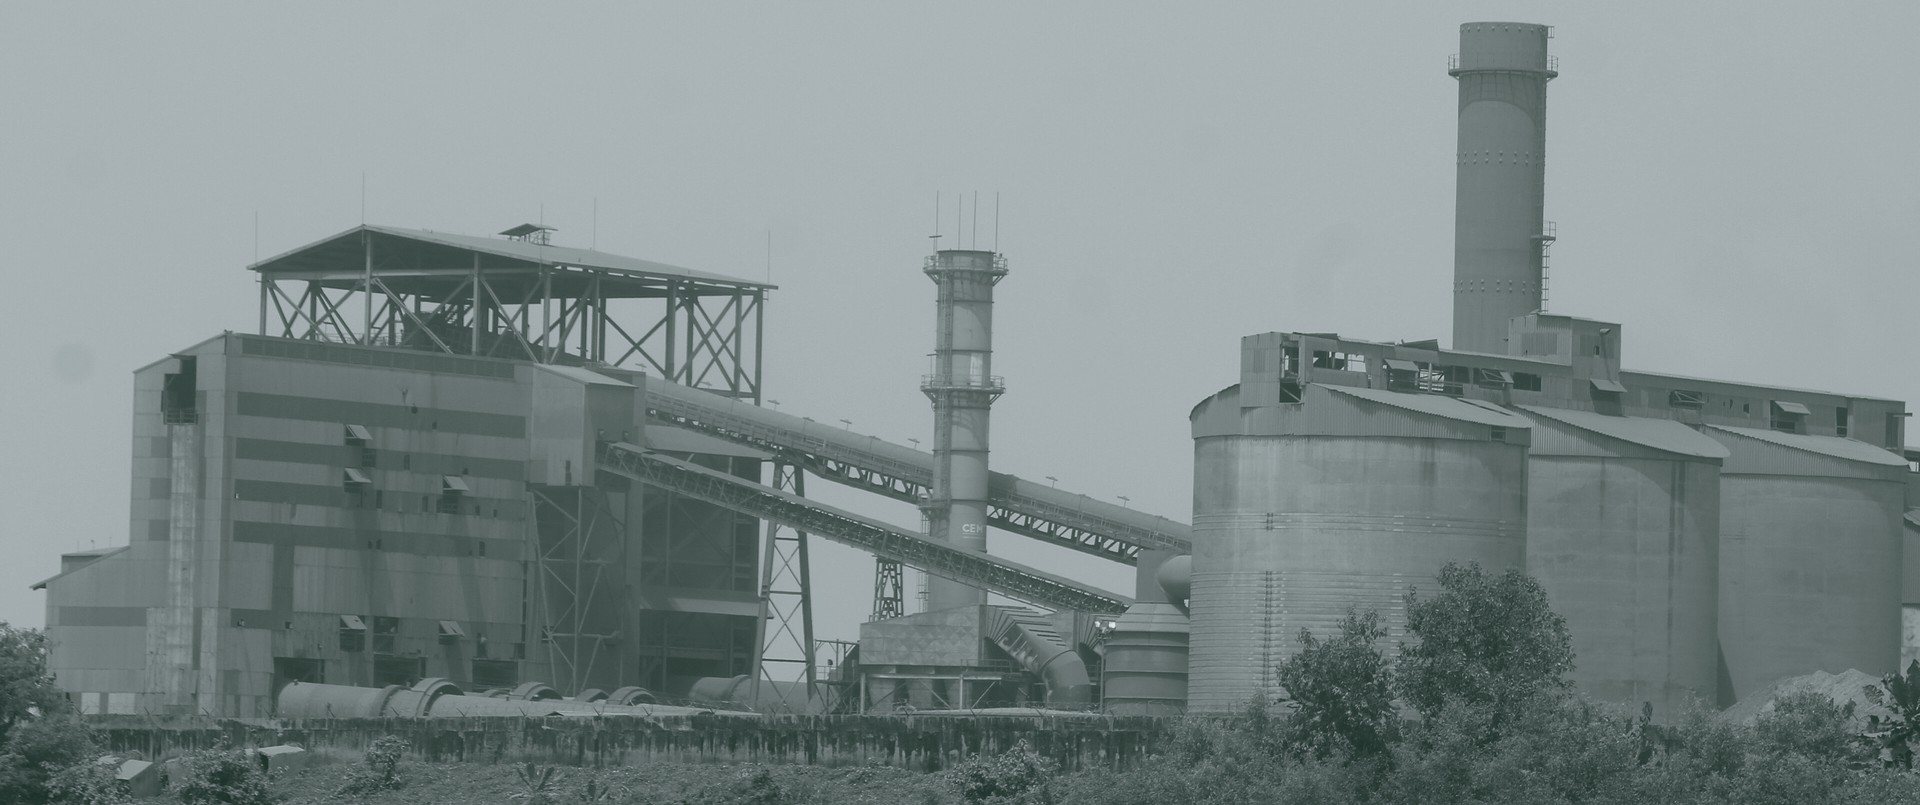
The push has a long pedigree. The African Union adopted beneficiation as policy in its Africa Mining Vision of 2009.13 Export restrictions on industrial raw materials then rose more than fivefold between 2009 and 2023, by the OECD’s count. The headline overstates the bans: among measures introduced in 2023, export taxes accounted for 54 per cent and outright prohibitions for 23 per cent.14 An earlier OECD paper had already found that restrictions play a “non-trivial role” in critical-mineral markets.15 By the OECD’s 2026 inventory, they cover up to 70 per cent of global cobalt and manganese exports.16
Exhibit 1 sets the legal status of each 2026 instrument against the physical status of the plant meant to satisfy it.
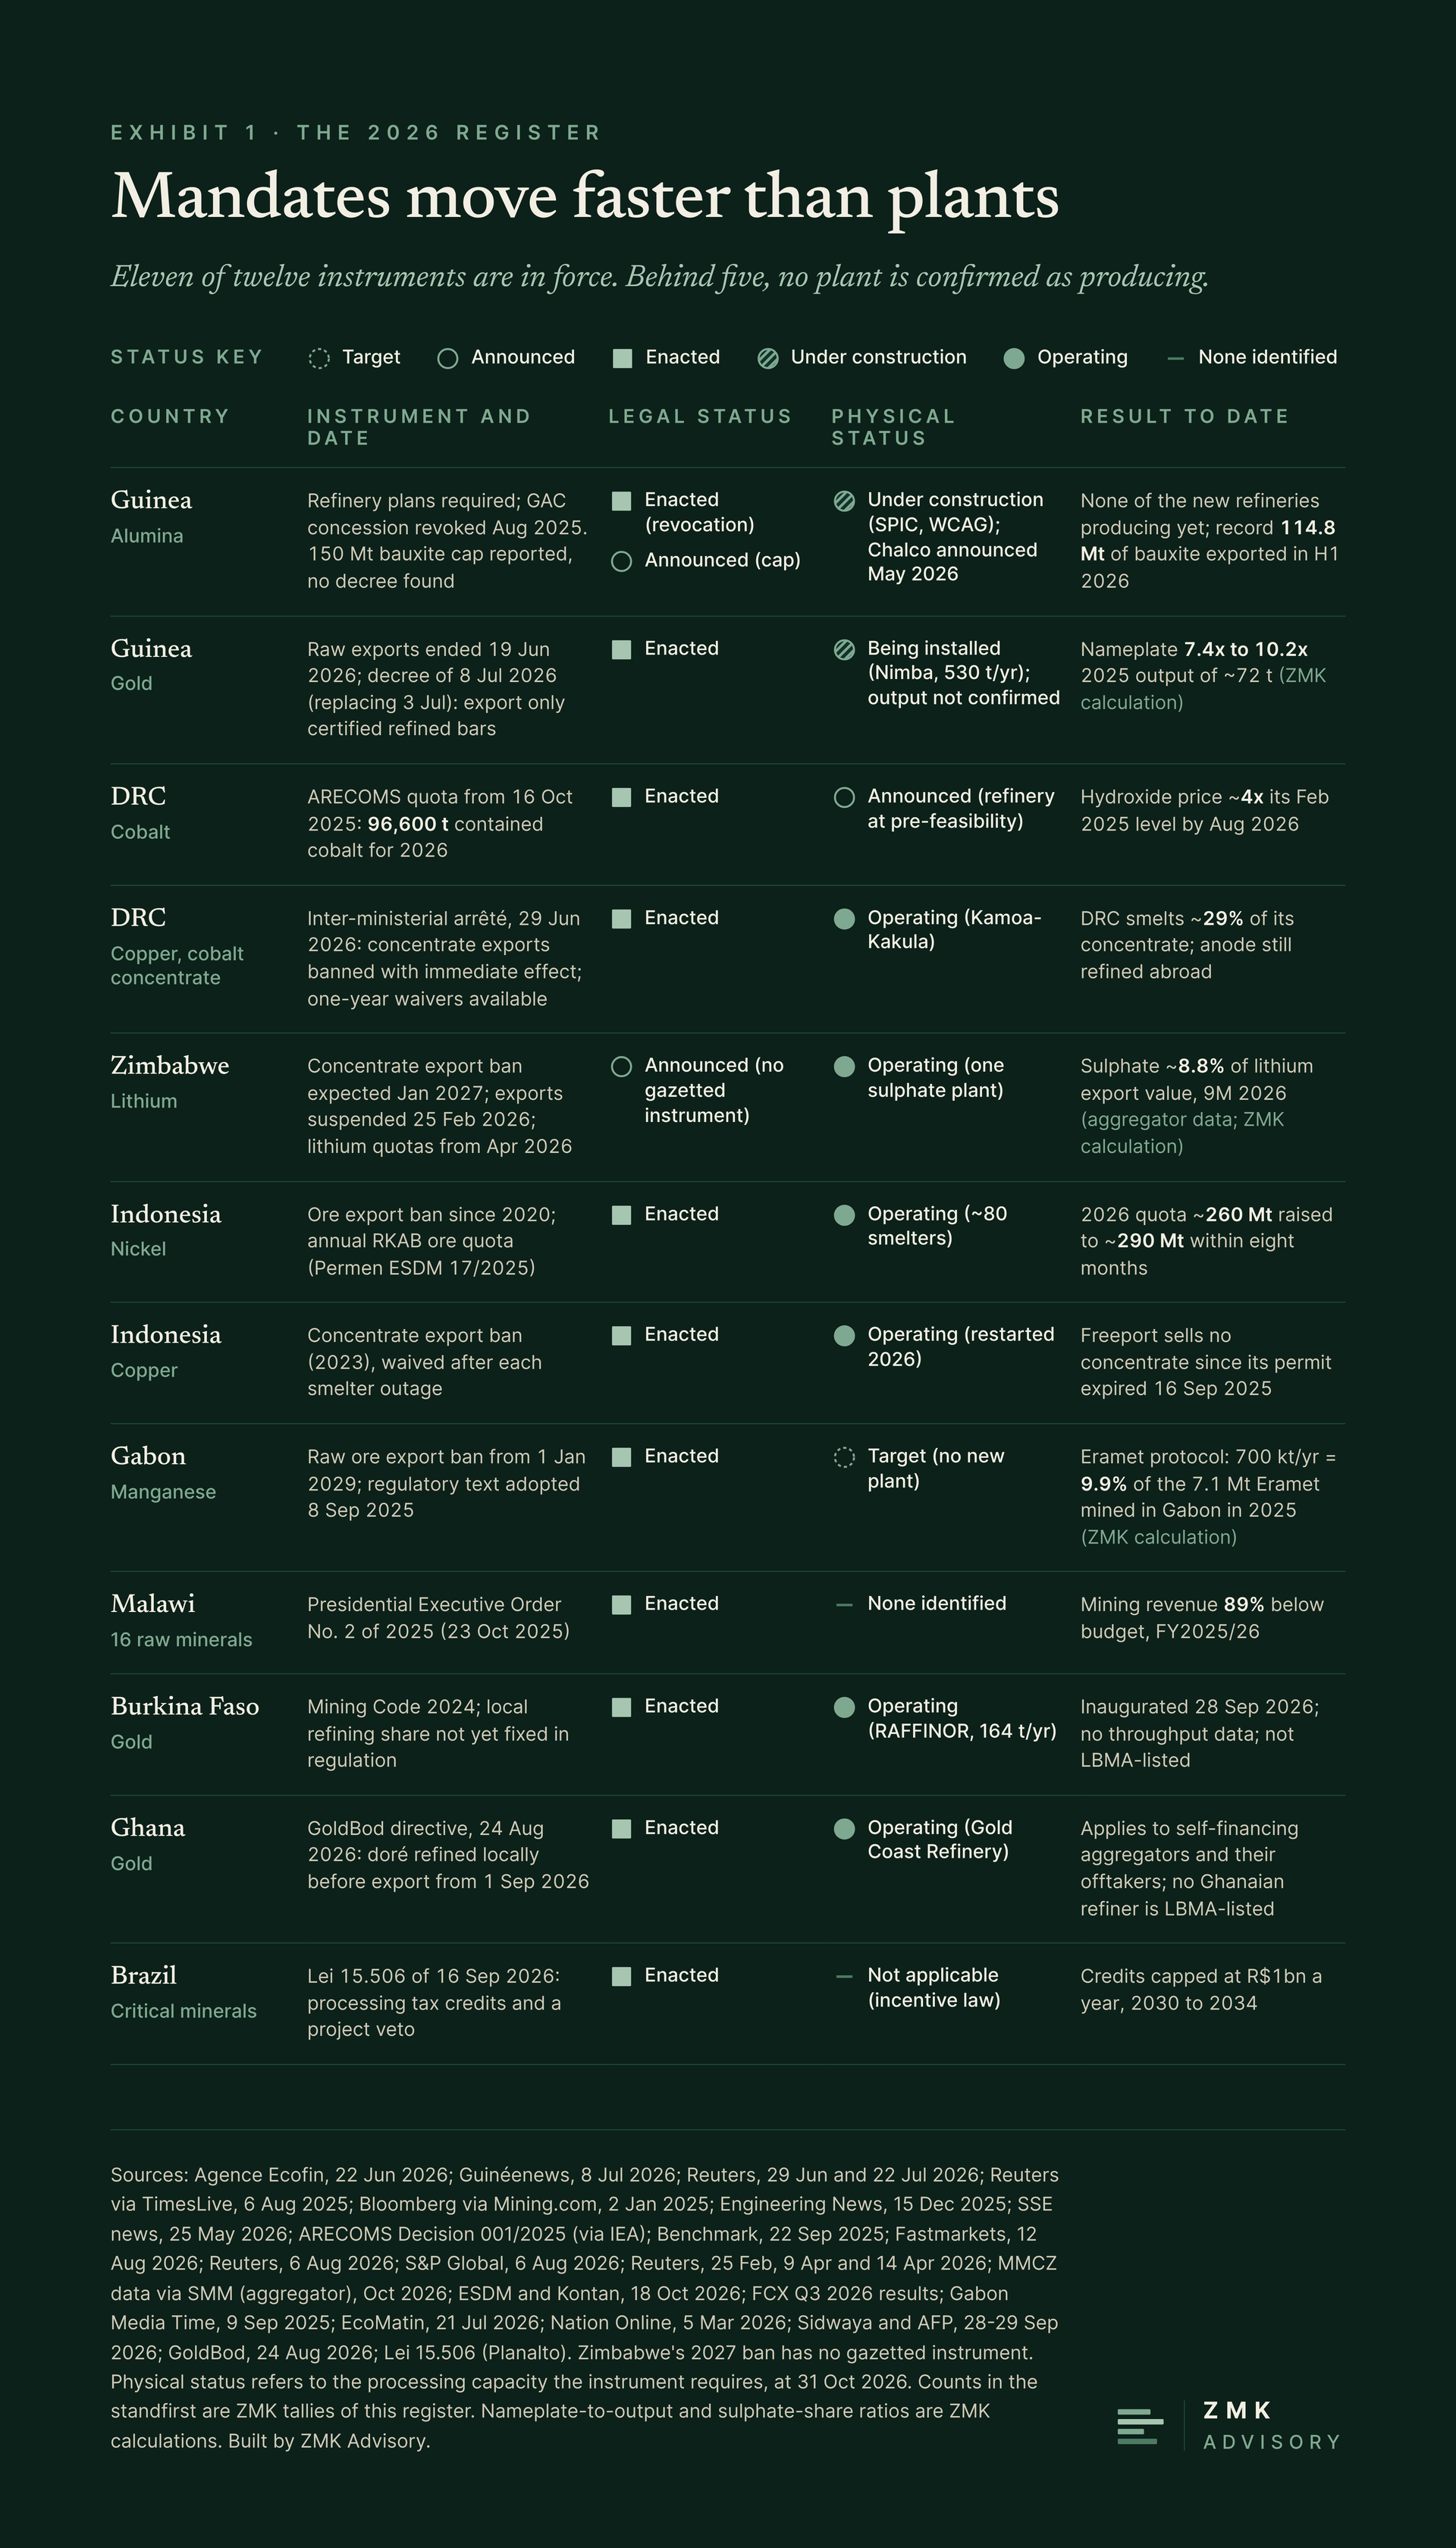
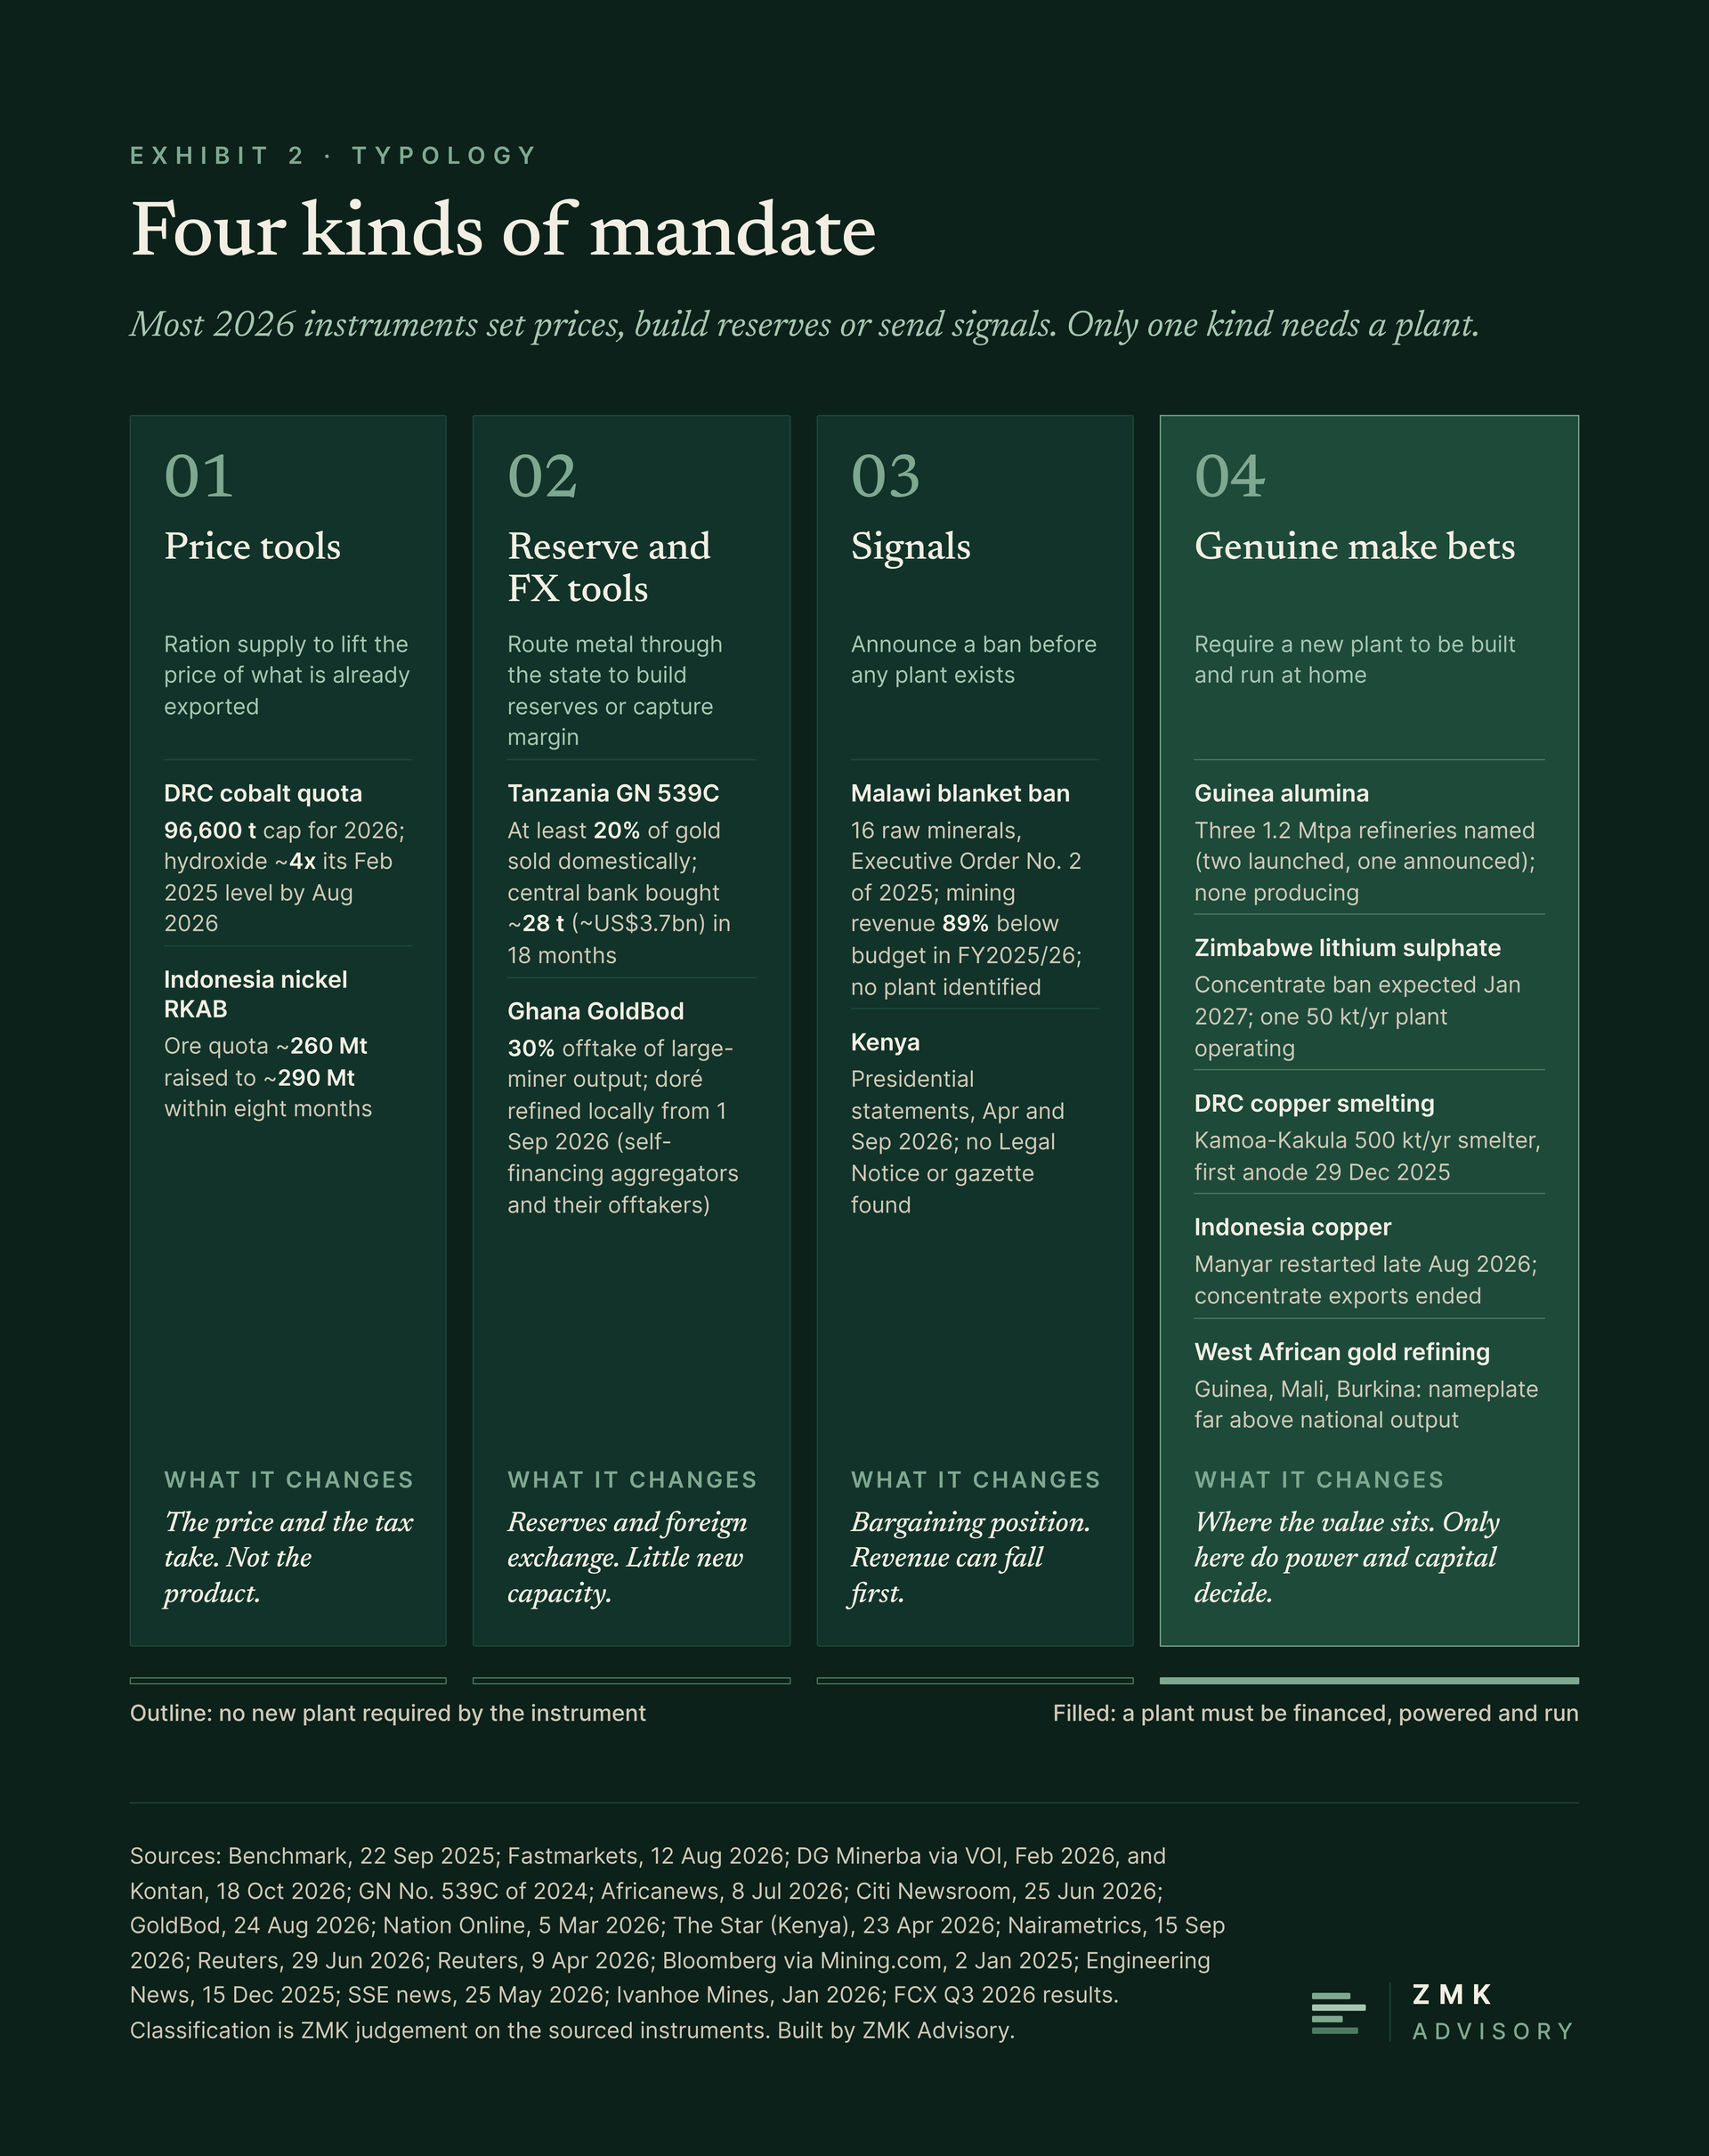
Sorted by what they do, most of these instruments make nothing (Exhibit 2). The first group are price tools. The DRC’s cobalt quota helped lift cobalt hydroxide to about four times its pre-ban level by August 2026, according to Fastmarkets,17 with no cobalt refinery under construction in the country that we could identify. A later and lower quote, not yet reconciled with that series, is set out in the technical notes. Indonesia rations nickel ore through annual mining quotas. It set the 2026 ceiling at about 260 Mt in February18 and raised it to about 290 Mt in October, eight months later.19
The second group build reserves and foreign exchange. Tanzania’s GN No. 539C of 2024 requires miners and dealers to set aside at least 20 per cent of their gold for domestic sale before an export permit is issued.20 Ghana’s GoldBod ordered that gold doré be refined locally before export from 1 September 2026, in a directive that applies to self-financing aggregators and their offtakers.21
The third group are signals. Malawi’s blanket ban has no processing project behind it, and its 2026/27 budget already projects revenue from a “lift” of the ban.12 Mexico reserved lithium to the state and faces an ICSID claim over it from Ganfeng and its UK units Bacanora and Sonora Lithium.22 Not every government has reached for a ban: Brazil legislated processing incentives instead, in Lei 15.506 of September 2026.23
The fourth group are genuine bets on making something: Guinean alumina, Zimbabwean lithium sulphate, Congolese copper smelting, Indonesian copper and West African gold refining. Where these are moving, a processor has brought its own capital and offtake. Huayou’s US$400m lithium sulphate plant in Zimbabwe exported its first cargo in April 2026.24 Ivanhoe’s 500,000 tonne-a-year Kamoa-Kakula smelter in the DRC produced its first anode on 29 December 2025, at a cost of about US$1.1bn.25 Six months later Kinshasa banned copper and cobalt concentrate exports with immediate effect, with one-year waivers available.26 Ivanhoe says a similar ban has been in place for close to ten years.27 In our reading the order is closer to codification than to a new demand. In Indonesia, Freeport’s PTFI has sold no concentrate since its export permit expired on 16 September 2025,28 and the Manyar smelter re-commenced operations in late August 2026.29
Guinea shows the gap most clearly, and is a case we examined in our Simandou analysis. It shipped a record 114.8 Mt of bauxite in the first half of 2026, up 15 per cent on a year earlier, according to ministry data reported by Reuters. The same report found that a widely reported cap on bauxite exports had not been implemented.30 Trade press has since put the cap at 150 Mt a year.31 We have found no decree or arrêté that creates it, so we treat it as a reported plan without legal force. In August 2025 the state revoked the concession of GAC, the bauxite venture of Emirates Global Aluminium, citing its failure to comply with rules requiring refinery-construction plans.32 EGA took a US$765m charge and settled in May 2026.33 A ministry adviser quoted by trade press counts three alumina refineries under construction, against a target of five refineries and 7 to 8 Mtpa by 2030.34 Three projects of 1.2 Mtpa each have been named: SPIC’s at Boffa, launched in March 2025;35 Winning Consortium’s WCAG at Dobali, launched in December 2025;36 and Chalco’s, announced in May 2026.37 None has yet produced a tonne. SPIC’s brings its own 250 MW power plant38 and is due for completion by the end of 2027.39
What the record says
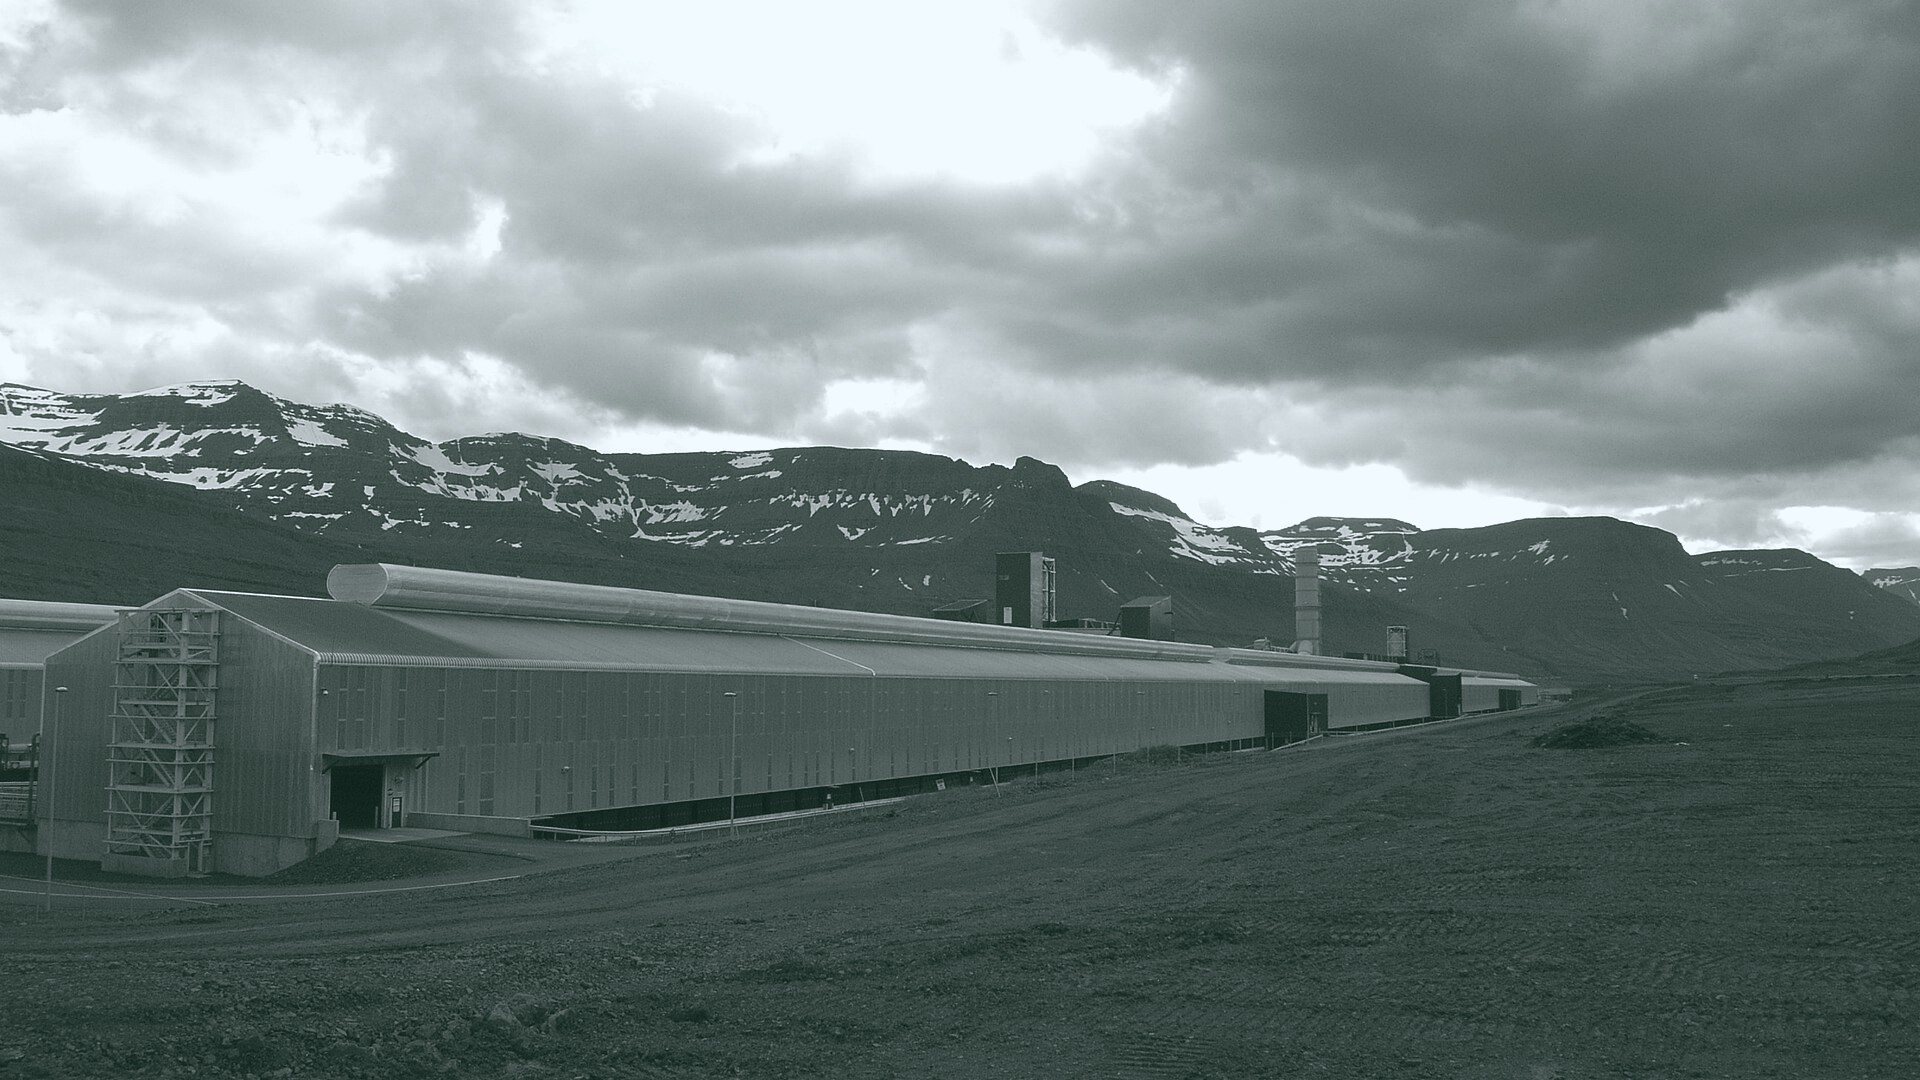
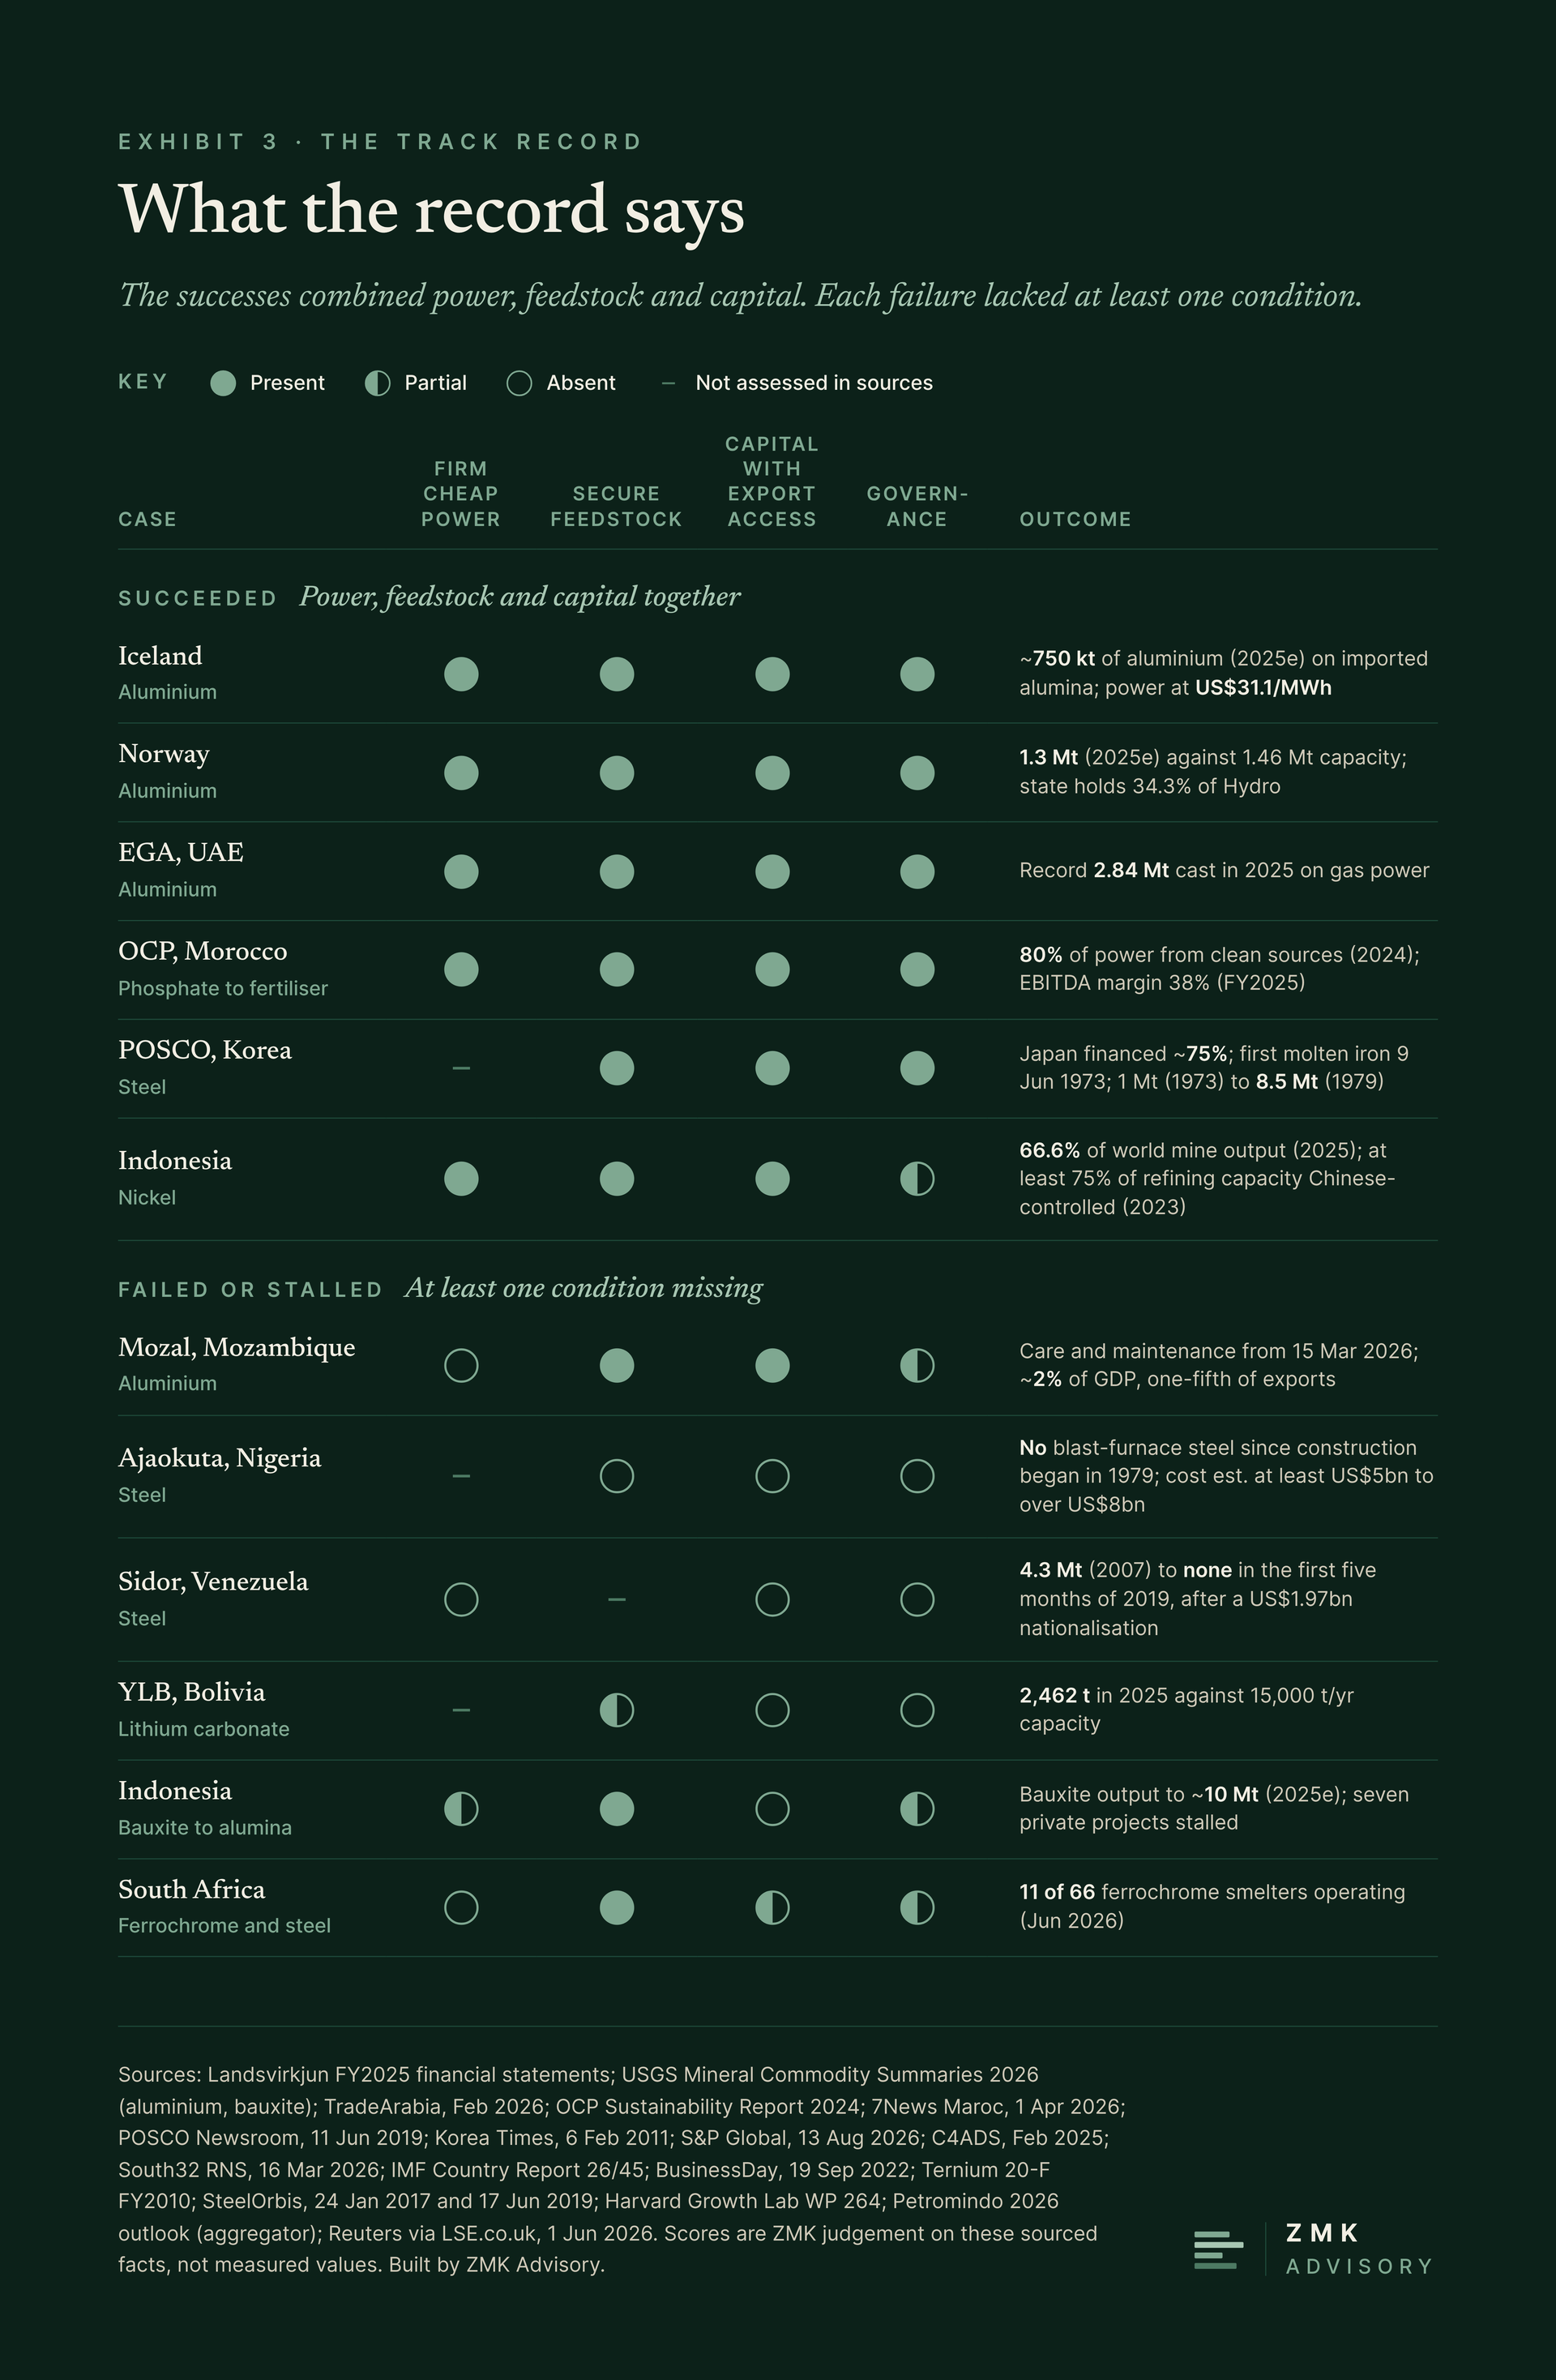
The plants that worked share the four conditions. Iceland, whose smelters include Rio Tinto’s ISAL, produced about 750,000 tonnes of aluminium in 2025 from imported alumina, and Norway 1.3 Mt, on US Geological Survey estimates.40 Landsvirkjun, Iceland’s state generator, sold power to industrial users at an average US$31.1 per MWh in 2025.41 On our calculation, at 13 to 15 MWh a tonne, that is about US$400 to US$470 of electricity per tonne of metal. Morocco’s OCP met 80 per cent of its electricity needs from cogeneration and wind in 2024, on captive phosphate.42 South Korea’s POSCO tapped its first molten iron on 9 June 1973,43 with about 75 per cent of its financing from Japan, after the World Bank declined to lend.44 The World Bank’s 1993 study, The East Asian Miracle, remains the standard reference for that developmental-state case.45
Indonesian nickel qualifies on volume. Indonesia mined 66.6 per cent of the world’s nickel in 2025.46 Its smelters arrived with Chinese capital, technology and offtake together. At least 75 per cent of the nickel refining capacity was Chinese-controlled in 2023.47
The failures each lacked at least one condition. Nigeria’s Ajaokuta steel complex, the subject of our field note, began construction in 1979. It was about 90 per cent complete when work halted in 1996, according to a 2003 US Embassy cable,48 or 98 per cent complete in 1994 by another account.49 Either way, it has never produced blast-furnace steel. No audited total of its cost exists; estimates run from at least US$5bn, the Nigerian government’s figure, to over US$8bn, the Manufacturers Association of Nigeria’s.48 Venezuela agreed to pay Ternium US$1.97bn to nationalise the Sidor steelworks in 2008 and 2009.50 Sidor made 4.3 Mt of crude steel in 200751 and none in the first five months of 2019.52 Our earlier piece, The Price of Control, examines what state control of such assets has cost. Power has done similar damage in South Africa, where only 11 of its 66 ferrochrome smelters were operating in June 2026.53 Bolivia’s state lithium company, YLB, produced 2,462 tonnes of lithium carbonate in 2025 at a plant built for 15,000. Chile produced about 298,000 tonnes of lithium carbonate equivalent, by the same paper’s count.54 Chile’s model is a partnership: Codelco holds 50 per cent plus one share of NovaAndino, and SQM manages the Atacama operations until 2030.55
Indonesia’s own record splits by mineral. Its bauxite ban drew little processing investment, and output and local employment fell, according to working-paper econometrics by Bosker and co-authors.56 The US Geological Survey now puts Indonesian bauxite output at about 10 Mt a year, after revising its 2024 estimate down from 32 Mt in the previous edition57 to 9.9 Mt.58 Bauxite export revenue had already fallen from US$1.3bn in 2013 to US$46m in 2014, after the first ban.59
Two old ideas explain the split. David Ricardo’s comparative advantage holds that a country gains by exporting what it produces relatively cheaply. Australia shipped 944 Mt of iron ore in 2025-26, unprocessed.60 Ronald Coase framed the firm’s make-or-buy choice in 1937,61 and Oliver Williamson later added the problem of the specific asset.62 A smelter tied to one power source or one ore body is such an asset. Once it is built, the investor and the host face each other in a bilateral monopoly, and the side that owns the capital and the power holds the stronger hand in every renegotiation. Indonesia conceded tax holidays of 5 to 20 years to attract its processors.59 Protection alone does not close the gap: in the classic test, Krueger and Tuncer found little evidence in Turkish manufacturing that newer industries raised productivity faster than traditional ones, a result from factories rather than mines.63
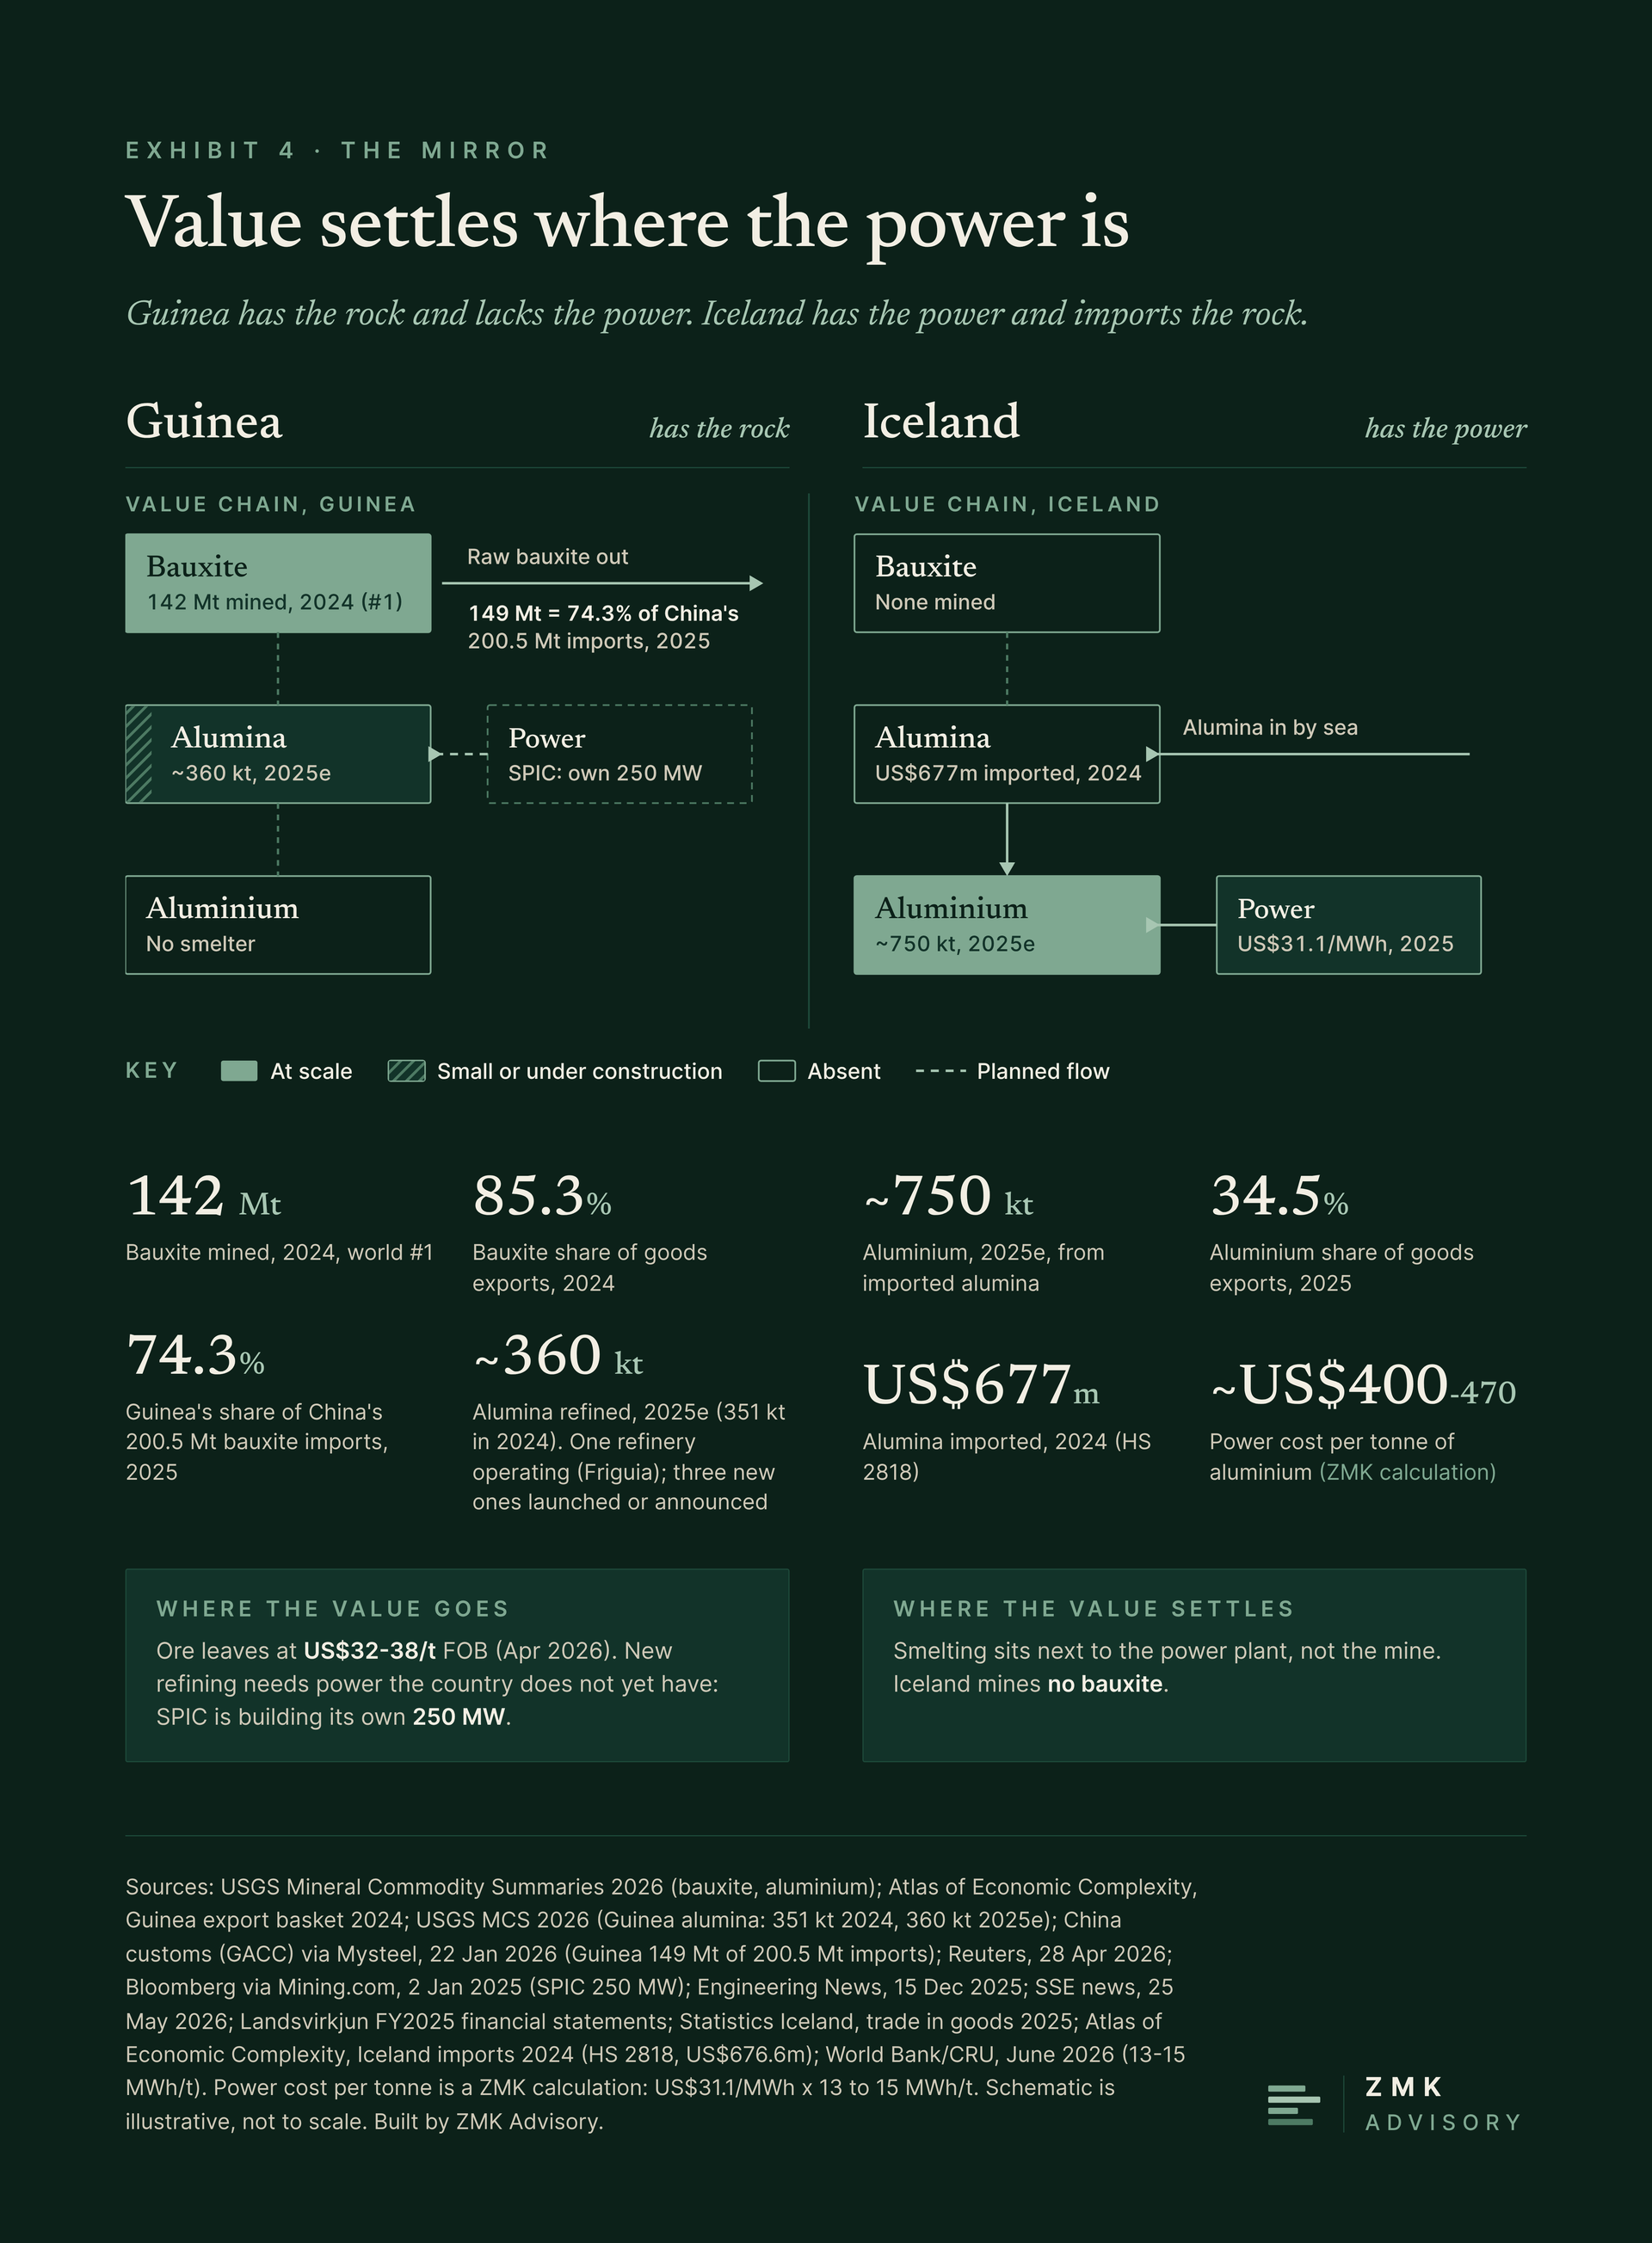
Guinea and Iceland are mirror images (Exhibit 4). Bauxite made up 85.3 per cent of Guinea’s goods exports in 2024,64 and Guinea supplied 149 Mt, or 74.3 per cent, of China’s 200.5 Mt of bauxite imports in 2025.65 It refined only about 360,000 tonnes of alumina in 2025, on a US Geological Survey estimate.58 Iceland imported US$677m of alumina in 2024,66 and aluminium made up 34.5 per cent of its goods exports in 2025.67 Smelting capacity settled where the firm power is.
Gold refining shows the same logic at small scale, where capital is cheap and certification decides. Burkina Faso’s RAFFINOR, inaugurated on 28 September 2026, cost CFA 11bn (about US$19m). It has capacity of 164 tonnes a year, rising to 515 tonnes, against more than 94 tonnes of gold mined in 2025, according to the World Gold Council.68 Mali’s state-controlled refinery at Sénou, launched in June 2025, has a 200-tonne capacity, which Reuters put at nearly four times Mali’s annual gold production;69 industrial output was 42.2 tonnes in 2025, on official data.70 Tanzania’s Mwanza refinery bought 2.995 tonnes of gold in 2025, about 1.7 per cent of its nameplate on our calculation, for want of feed.71 Each was sized well beyond the gold available to it (Exhibit 5). None of the new West African refiners appears on the LBMA Good Delivery List, which has one African refiner, Rand Refinery, according to trade press.72 This is our judgement, based on that listing: without accreditation the bars need an accredited melt abroad to reach the deepest market, so the value kept at home is the assay and refining margin.
The macro check
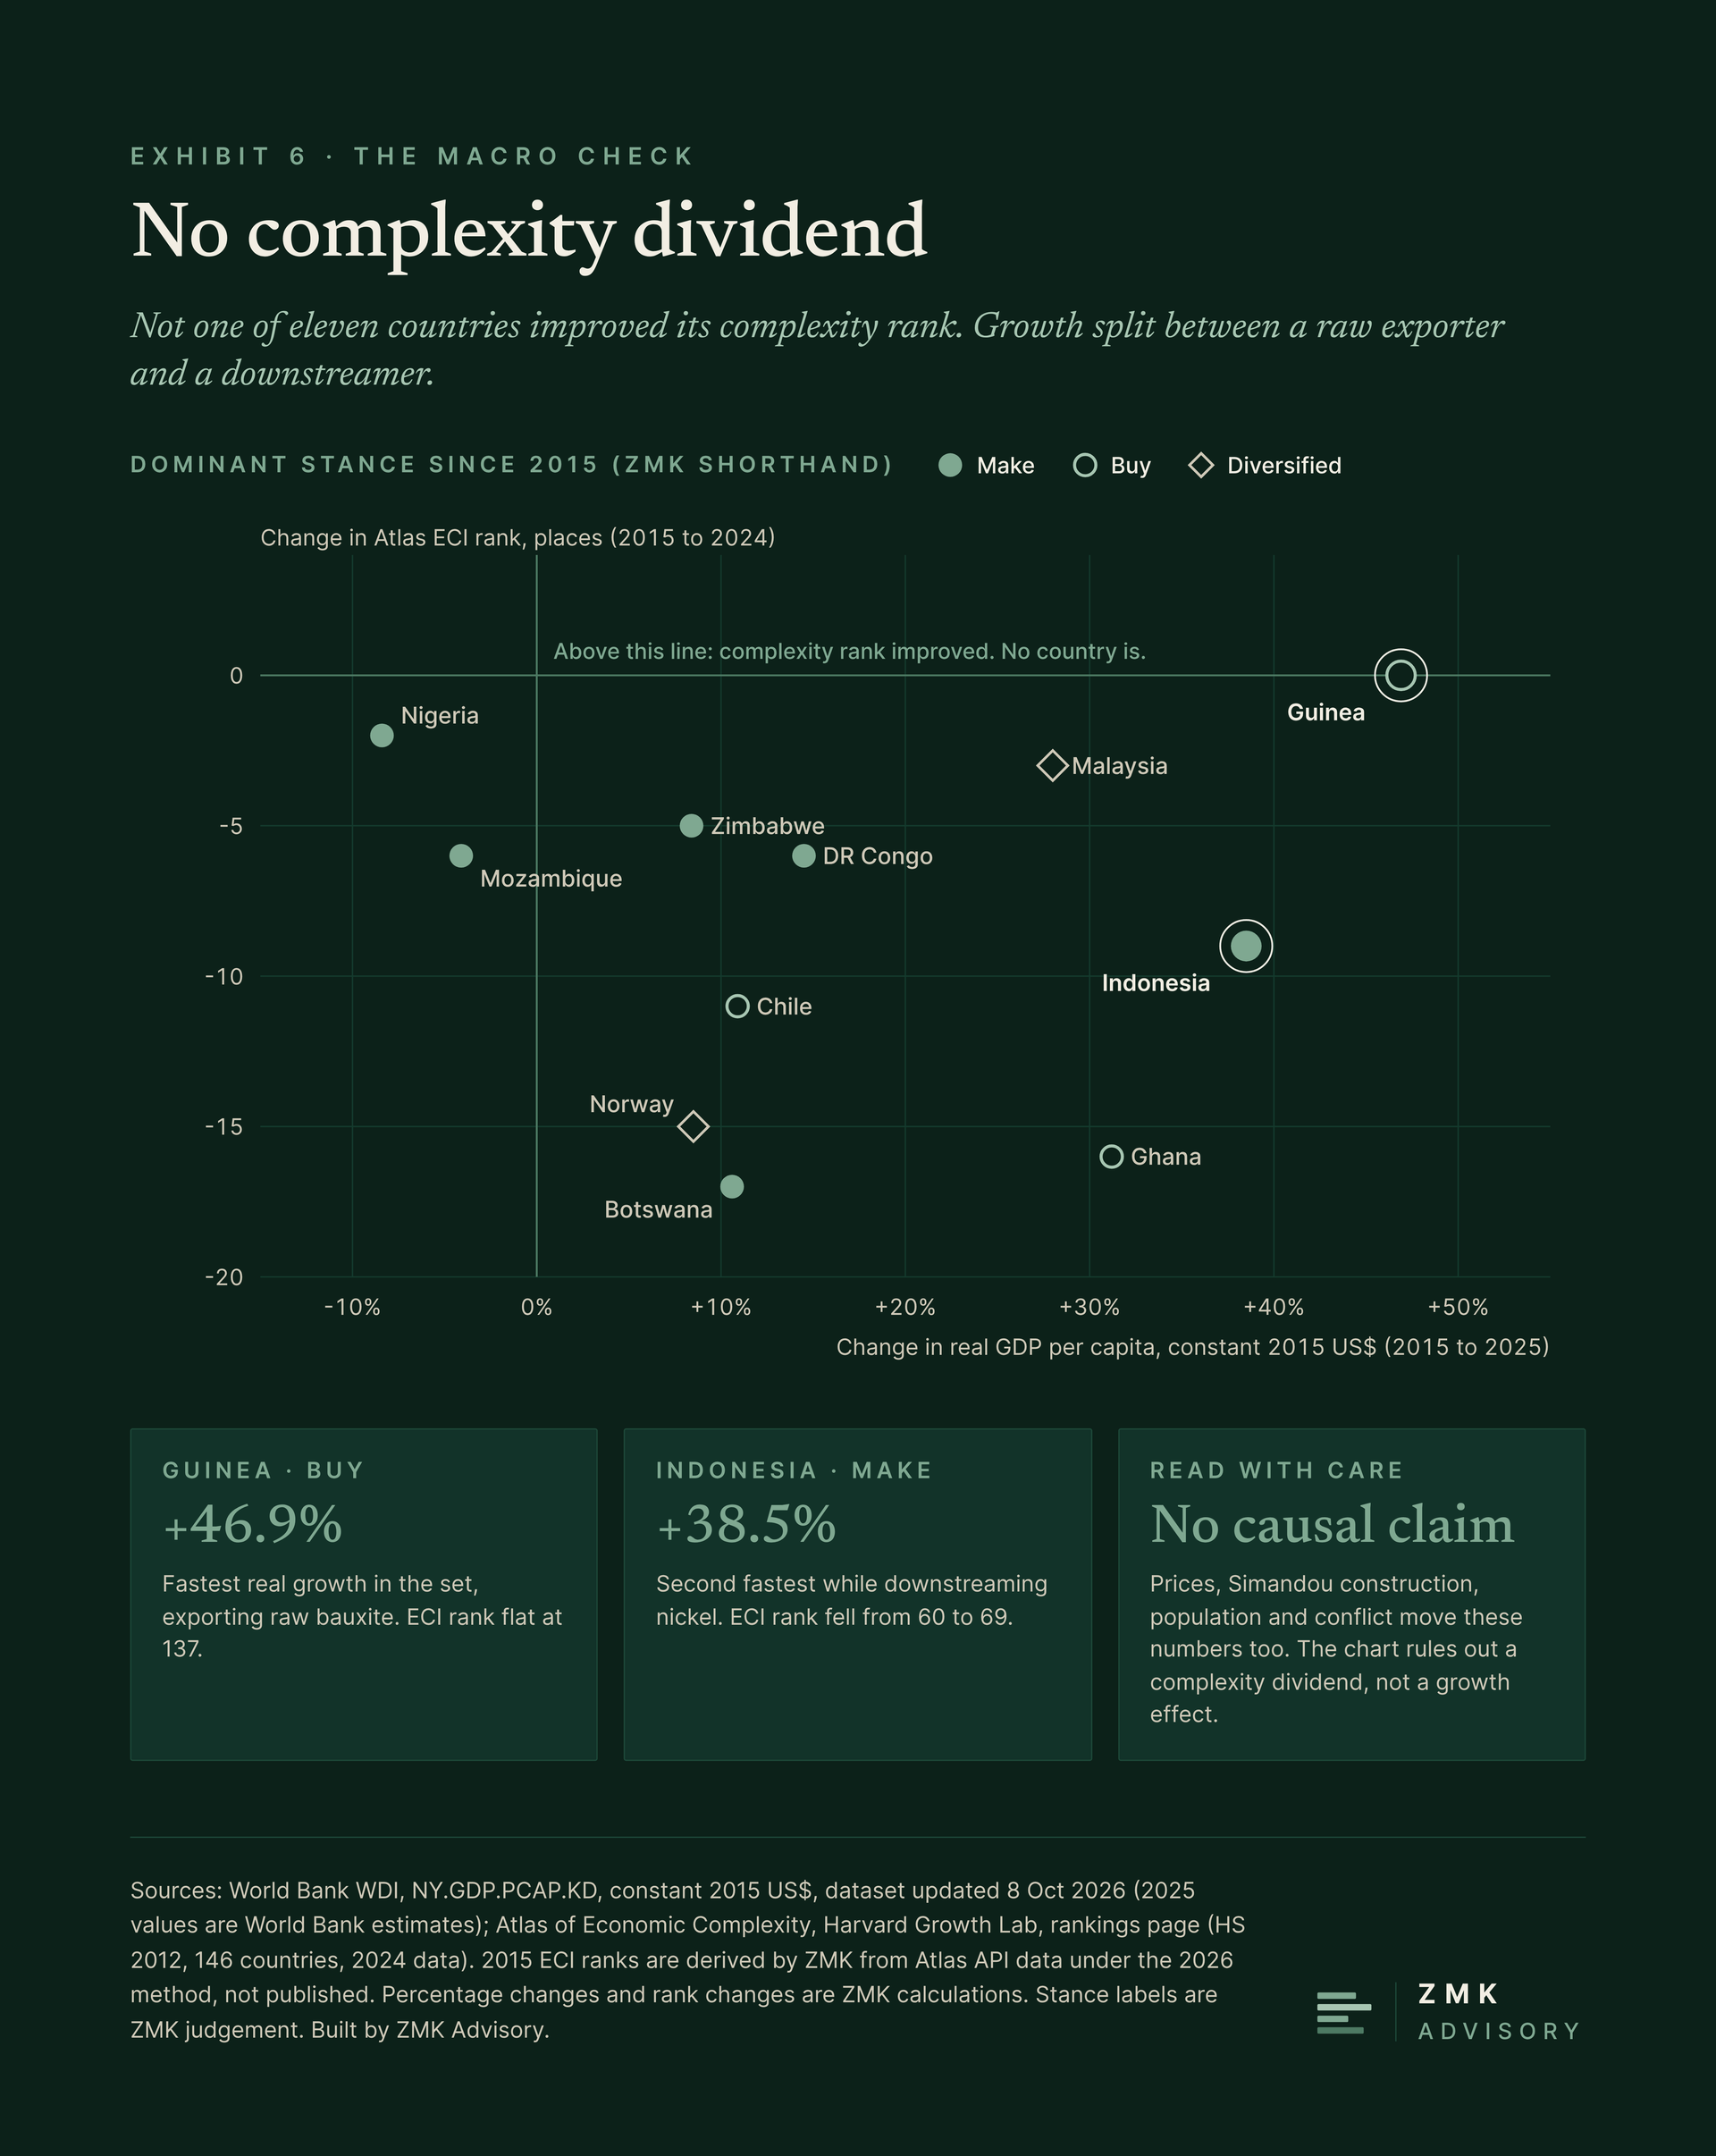
The macro data offer a check on this reading. Of the 11 mineral and energy exporters we ranked on Atlas data, none improved its economic-complexity position between 2015 and 2024.4 Indonesia fell from 60th to 69th. The DRC, where refined copper makes up 65.9 per cent of goods exports,73 fell from 139th to 145th of 146. Ghana fell 16 places and Botswana 17, the two pioneers of beneficiation in gold and diamonds. The 2015 ranks are our derivations from Atlas data, explained in the technical notes.
Growth points the other way. On our calculation from World Bank data in constant 2015 dollars, Guinea’s GDP per head rose 46.9 per cent between 2015 and 2025, the fastest in our 19-country sample, while it exported raw bauxite.74 Indonesia came second, at 38.5 per cent, while it built its smelters. Its complexity rank fell 9 places over the same years. Mozambique’s real income per head fell 4.1 per cent. Iceland’s, on the same imported-alumina model as Mozal, rose 10.1 per cent.
Neither result settles the argument, and we make no causal claim in either direction. In our reading, Guinea’s growth rests on bauxite volume and, since late 2025, Simandou construction. Nickel is a small part of Indonesia’s large, diversified economy. Commodity prices, conflict and currency crises move the rest. The narrower findings hold up. Aluminium made up 65.1 per cent of Mozambique’s goods exports in 2005 and 10.3 per cent in 2024.75 A single plant can carry an export base and take it away again.
Indonesia’s exports of nickel ore, iron and steel, and nickel went from US$3.84bn in 2013 to US$2.29bn in 2015 and US$31.83bn in 2024, on our sum of Atlas product lines.76 The dip matches the OECD’s finding that revenues “fell for several years after the bans before recovering”.77 The same case studies find that domestic gains were “mostly limited to primary processing or went largely to foreign investors”.77 A World Bank working paper by Kee and Xie finds a higher domestic value-added share in Indonesia’s downstream industries after the 2014 ban, alongside more entrants, smaller firms and aggregate efficiency losses.78 The authors’ presentation puts the rise in the domestic value-added ratio of iron- and steel-using industries’ exports at 5.6 per cent between 2011 and 2022, worth about 1.1 percentage points of total export domestic value added, while national domestic value added fell overall.79 A peer-reviewed input-output study finds that nickel’s forward linkages narrowed from 16 sectors in 2010 to 4 in 2020.80 Another finds that the bans induced under-reporting or reclassification equal to 3.45 to 14.75 per cent of import volumes.81 The prize per stage is large: in 2022 the unit value of Indonesian nickel ore exports was about US$60 a tonne, against a global average of US$25,053 for unwrought nickel, which Indonesia does not make, according to US International Trade Commission staff.82
The peer-reviewed analogue comes from forestry. Across 86 developing countries, log export bans raised sawnwood output by about 2 per cent and sawnwood exports by about 8 per cent, with no significant effect on more complex veneer.83 On that evidence, bans tend to move a country one stage up the chain and rarely further. The IMF’s warning is blunter: export bans on raw materials “can backfire and cause production to fall”.84 No published study measures how much of Indonesia’s nickel value stays at home and how much leaves. Ownership is the best available proxy, and at least three-quarters of the refining capacity was Chinese-controlled in 2023.
Three deadlines and the test
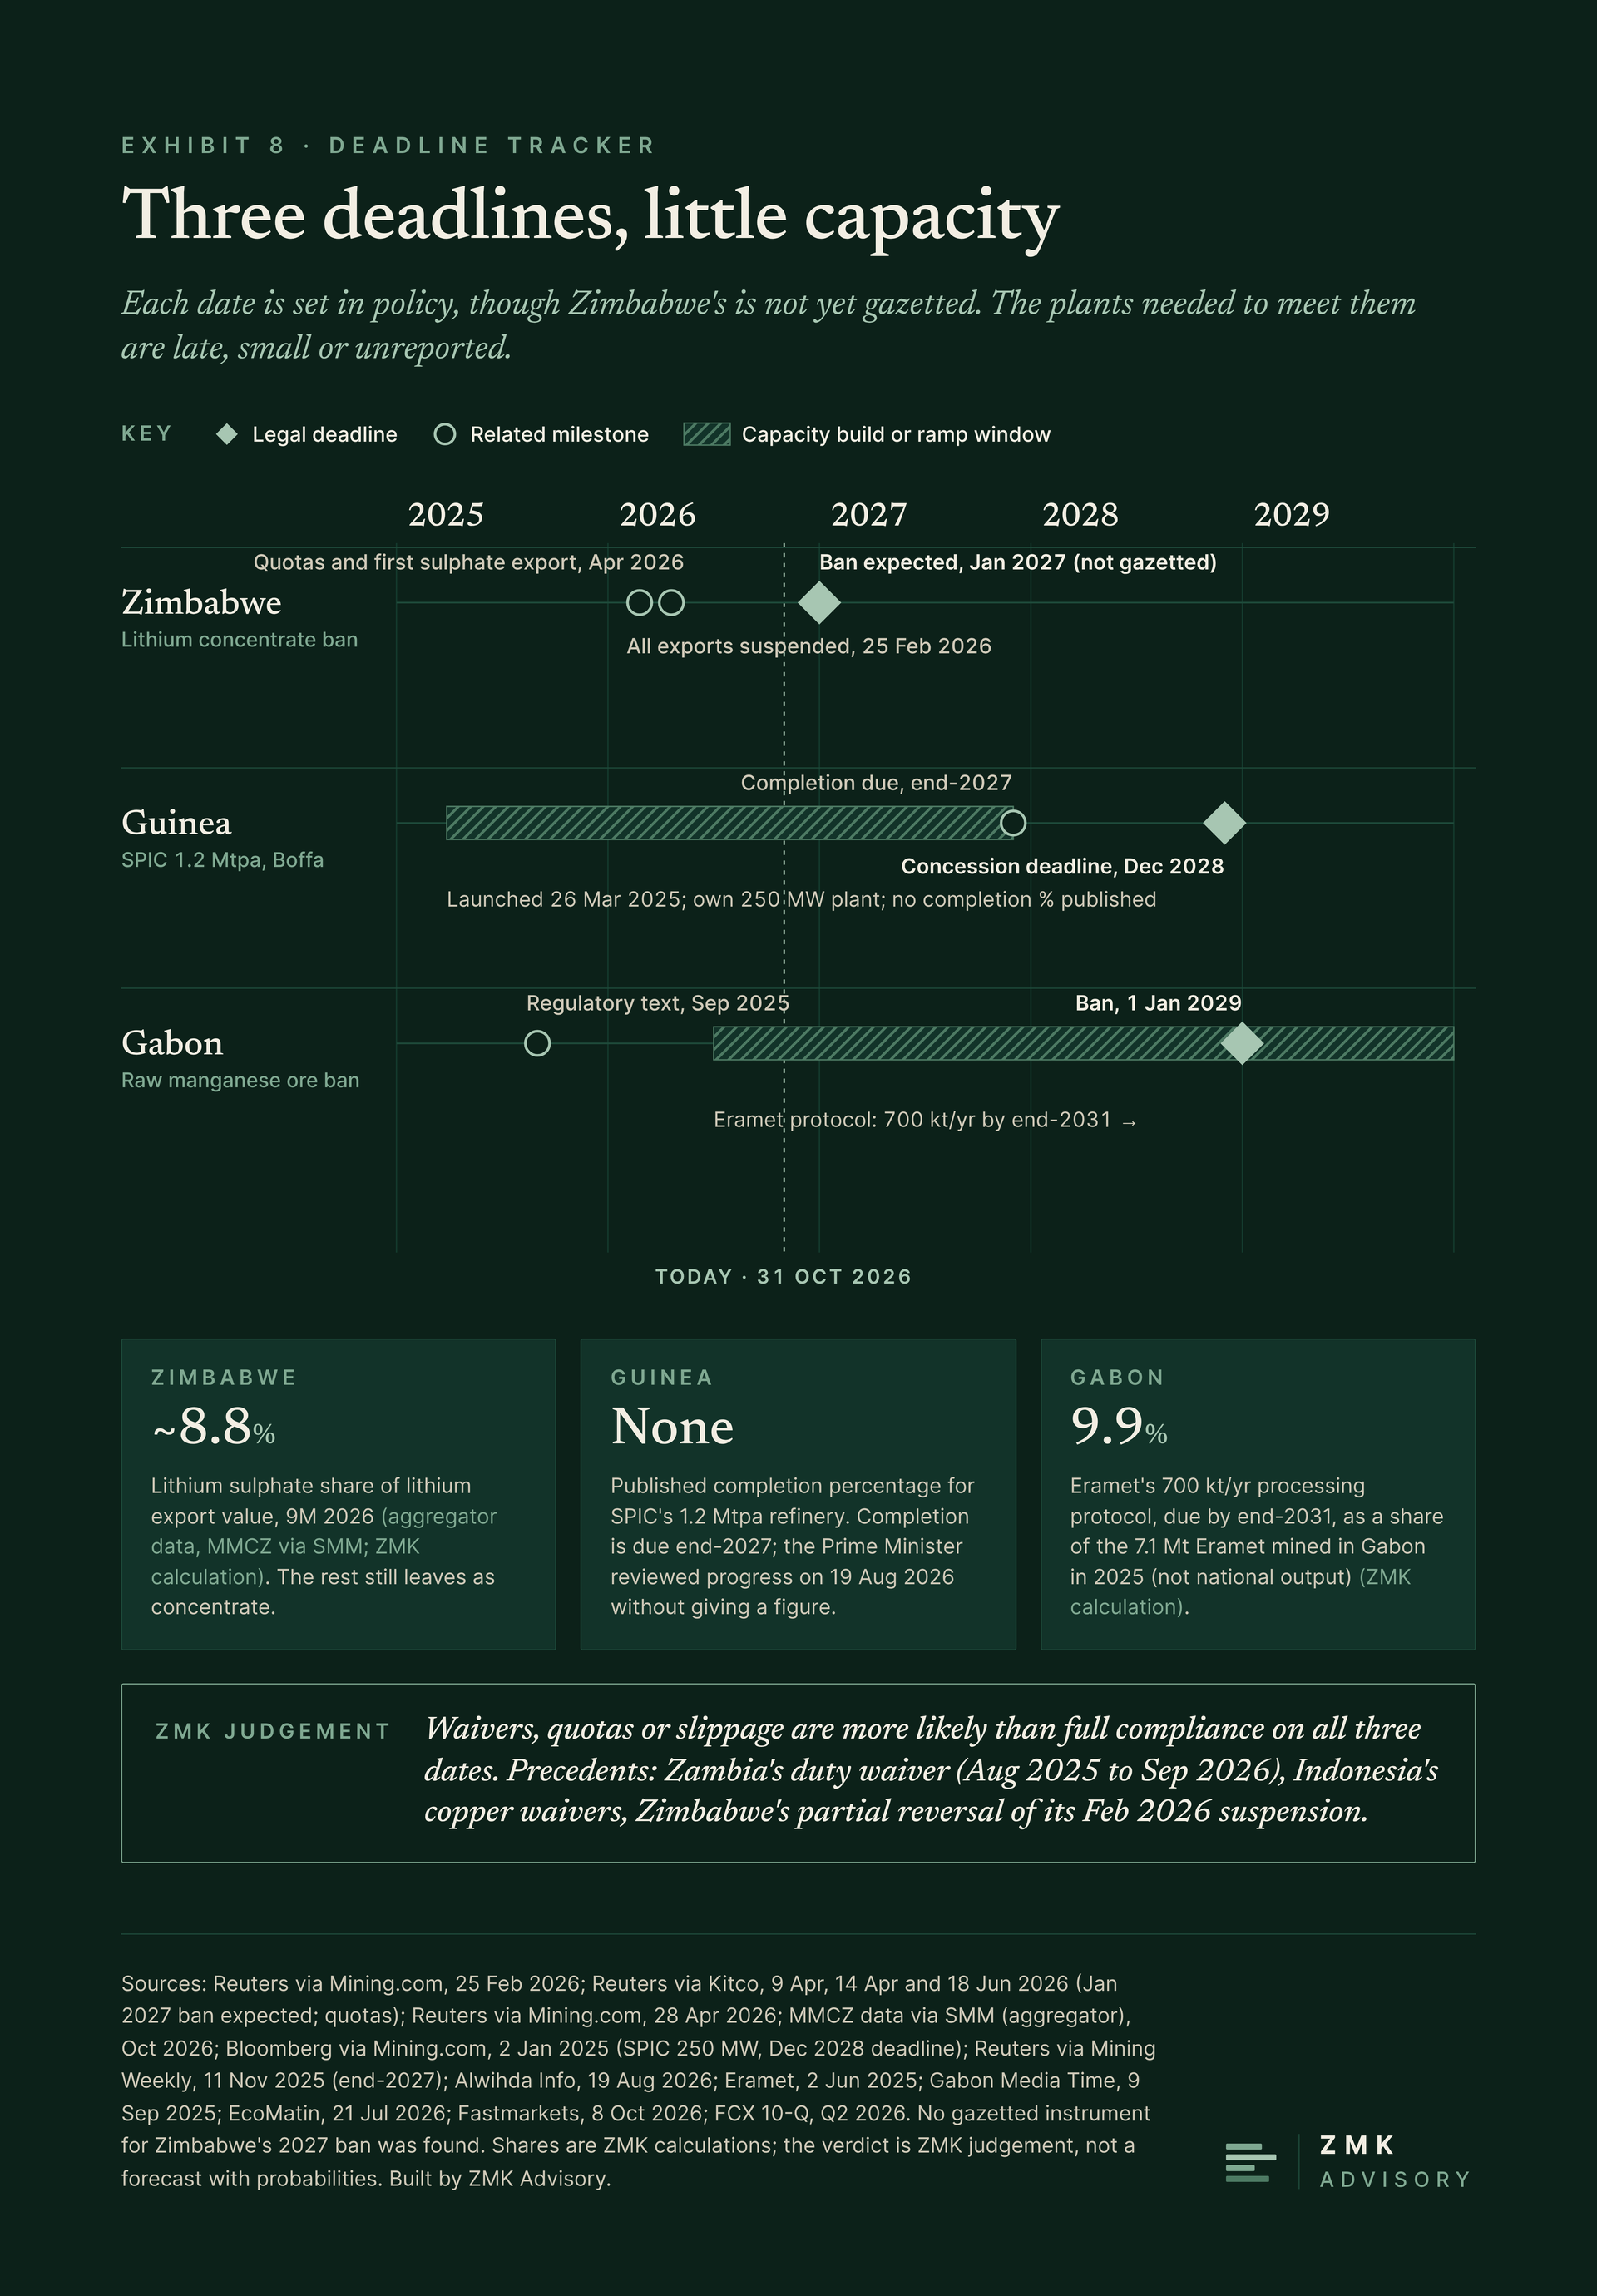
Three deadlines fall due within the next 27 months. On the evidence, each is more likely to end in waivers, quotas or slippage than in full compliance. This is our judgement, offered as a forecast and based on the capacity in place at 31 October 2026.
Zimbabwe’s concentrate ban is expected in January 2027. In the first nine months of 2026 lithium sulphate earned US$191m of the country’s US$2.159bn of lithium exports, about 8.8 per cent on our calculation from national marketing-board data reported by trade press.85 SPIC’s Guinean refinery is due for completion by the end of 2027;39 the Prime Minister reviewed progress in August, and no completion percentage was published.35 Gabon bans raw manganese ore exports from 1 January 2029.86 Eramet has agreed to process up to 700,000 tonnes of ore a year locally by the end of 2031,87 which is just under 10 per cent of the 7.1 Mt Eramet mined in Gabon in 2025, on our calculation.
The precedents point the same way. Zambia suspended its 10 per cent copper concentrate export duty from August 2025, while major smelters underwent maintenance, until the waiver expired on 30 September 2026.88 Indonesia kept granting copper concentrate export relaxations through smelter outages after its 2023 ban, and Freeport’s permit lapsed only in September 2025.28 Zimbabwe suspended all raw mineral and concentrate exports on 25 February 2026,89 then partly restored lithium concentrate exports in April under company quotas,11 the first reported on 14 April.90
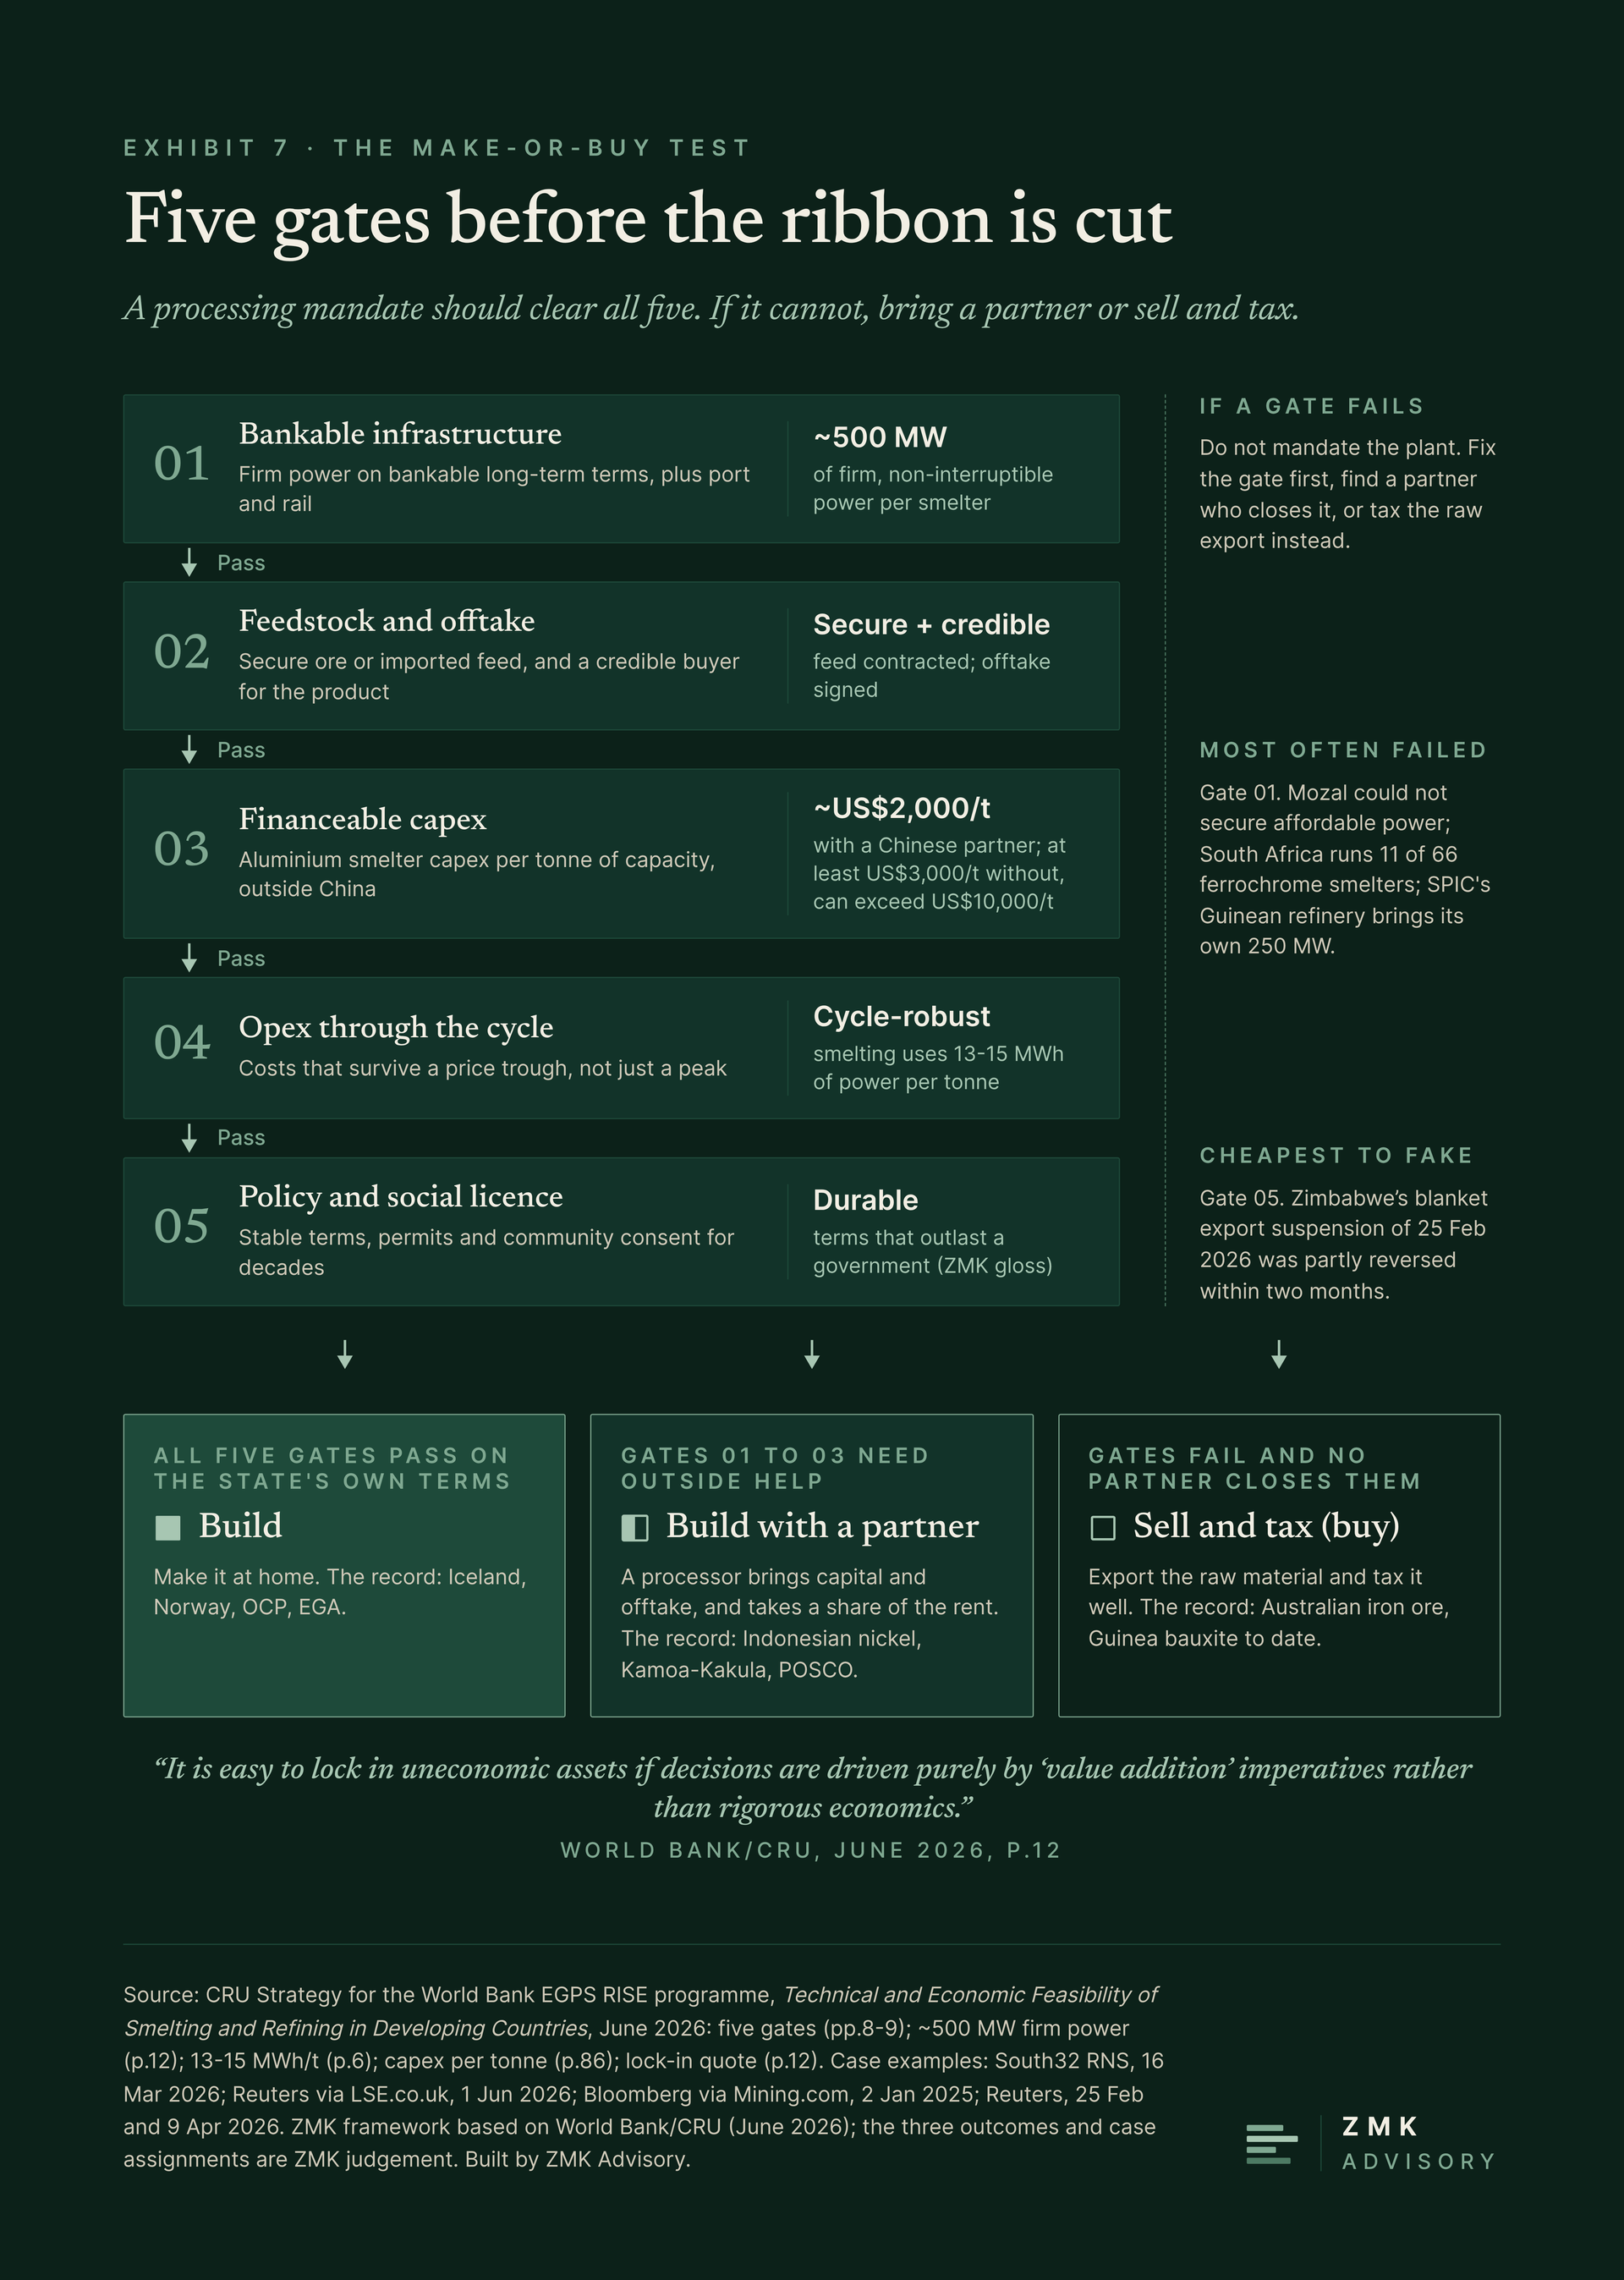
The World Bank study sets five pass-fail gates for any processing project: bankable infrastructure, secure feedstock with credible offtake, financeable capital cost, operating cost that survives the cycle, and policy and social licence.1 We apply them, in order, as a make-or-buy test that a board or ministry should clear before capital is committed (Exhibit 7).
The first gate is power. A plan that cannot name the owner of about 500 MW of firm supply, and the term of the contract, fails here. Mozal ran for a quarter of a century on contracted power and stopped when it could no longer secure affordable supply. The second is feedstock and offtake. In our judgement Kamoa-Kakula passes it, and Guinea’s gold refinery, sized at seven to ten times national output, does not. The third is capital. At US$2,000 a tonne with a partner and at least US$3,000 without, the cost of capacity decides who will own the plant. The fourth is cost through the cycle. A smelter that runs only on a negotiated power-tariff cut, as the Glencore-Merafe ferrochrome venture now does at 62c/kWh against an interim 87.74c/kWh, has not passed it.91 The fifth is licence: a mandate that can be reversed quickly, as Zimbabwe’s blanket suspension was, in part, within two months, gives no investor a reason to build.
Mozal had its alumina, its customers and shareholders with capital. It did not own its power, and when affordable supply ran out one-fifth of Mozambique’s exports stopped with it. Every mandate in the 2026 wave will meet the same arithmetic: about 500 MW of firm supply per smelter, paid for by someone. The first line of any processing plan should name who owns that 500 MW, and what happens when the contract ends.
ZMK Advisory runs this test for ministries, sovereign funds and their industrial partners before a mandate is signed or capital is committed. We name the owner of the power, the source of the feed, the party that pays for the plant and the price at which it still runs at the bottom of the cycle. A mandate that clears all five gates is worth enacting. One that fails them leaves the state with a plant it pays for and a smelter that does not run.
Secure the megawatts first.
Then mandate the metal.
If a processing mandate, an export ban or a smelter decision is on your desk, write to us before the decree. One reply from a principal, within a working day.
[email protected]Technical notes
Definitions. A processing mandate is any legal or policy instrument that requires, or strongly rewards, domestic processing of a mineral before export: an export ban, quota, duty, refining decree, set-aside or state offtake. Legal status (target, announced, enacted) is distinct from physical status (announced, under construction, operating); Exhibit 1 records both. Firm power means non-interruptible supply contracted on bankable long-term terms, as defined by the World Bank/CRU study. Make and buy are our shorthand for a country’s dominant mineral stance since 2015 and are judgements, not data. The four conditions (firm cheap power, secure feedstock, capital with export-market access, disciplined governance) are our synthesis of Register 2 of the research dossier; they map closely to the World Bank/CRU five gates.
Our calculations. Nimba Gold Refinery to 2025 Guinean output: 530 / 72 = 7.4 times; 733 / 72 = 10.2 times. Landsvirkjun power cost per tonne of aluminium: 31.1 x 13 = US$404; 31.1 x 15 = US$467, shown as about US$400 to US$470 (energy only, excluding transmission and other inputs). Mwanza utilisation: 2,995 kg / (480 kg x 365 days) = 1.7%, assuming the daily nameplate applies every day of the year. RAFFINOR capacity to Burkina output: 164 / 94 = 1.74 times; because output was “more than 94 t”, the true multiple is somewhat lower, so the exhibit shows “about 1.7x on 94 t”. Sénou capacity to Mali industrial output: 200 / 42.2 = 4.7 times, treating the 200 t as annual (Reuters gives no time basis but compares it with annual production). Guinea output: 2.32 Moz x 31.1035 g/oz = 72.2 t. Guinea share of China’s 2025 bauxite imports: 149 / 200.5 = 74.3% (as published by GACC via Mysteel). Zimbabwe partial reversal: 25 February to the 2 April ministry letter is 36 days, to the 9 April Reuters report 43 days and to the first reported quota (14 April) 48 days, shown as “within two months”. Zambia waiver: August 2025 to 30 September 2026, about 13 to 14 months. Zimbabwe lithium sulphate share: 191 / 2,159 = 8.8%. Eramet protocol share of its own 2025 Gabonese ore output: 0.7 / 7.1 = 9.86%, shown as 9.9% and “just under 10 per cent” (the research dossier rounded it to 9.8%; v1.0 also wrongly called 7.1 Mt national output). Real GDP per capita, constant 2015 US$, 2015 to 2025: Guinea 1,098 / 747 = +46.9%; Indonesia 4,555 / 3,288 = +38.5%; Iceland 58,910 / 53,506 = +10.1%; Mozambique 586 / 611 = -4.1%. Atlas rank changes, 2015 to 2024: Indonesia 60 to 69 (-9); DRC 139 to 145 (-6); Ghana 109 to 125 (-16); Botswana 77 to 94 (-17); Guinea 137 to 137 (0); Malaysia -3; Norway -15; Chile -11; Zimbabwe -5; Mozambique -6; Nigeria -2. World Bank/CRU capital cost: “around $2000/t” with Chinese partnership and “at least $3000/t” without are quoted from the text accompanying Figure 103 (p.86); they are the study’s figures, not ours. Indonesian nickel chain: sum of Atlas lines for nickel ore (HS 2604), iron and steel (HS72) and nickel (HS75), US$3.84bn (2013), US$2.29bn (2015), US$31.83bn (2024); HS72 includes stainless and carbon steel not made from Indonesian nickel. Deadline horizon: 31 October 2026 to 1 January 2029 is 26 months; to January 2029 inclusive, 27 months. CFA 11bn to ~US$19m is AFP’s conversion.
Comparability. GDP per capita is in constant 2015 US$ (WDI), not current dollars; growth rates in current dollars differ materially, which is why an earlier claim that Iceland “more than doubled” GDP per capita since 2010 was withdrawn. The 2025 values are World Bank estimates. The 2015 Atlas ranks are not published: they were derived by us from the Atlas GraphQL API (countryYear, HS12, eciFixed), ranking the same 146 countries, and the method matched the Atlas’s own chart values for four test countries. From 2026 the Atlas recomputes history with a continuous RCA method, so ranks differ from older editions and press quotes. Iceland, Bolivia, Qatar, the UAE, Australia, Zambia, Malawi and Morocco were not re-ranked under the current method and are excluded from the complexity comparison; Iceland therefore appears in Exhibit 6 on growth only. Indonesian bauxite output is the USGS series, which revised 2024 from 32 Mt to 9.9 Mt; it is not the ministry RKAB permit series (12 to 15 Mt for 2025), and 2023 has not been revised. Gold-output figures differ in basis: Burkina Faso’s “more than 94 t” is a World Gold Council figure reported by AFP; Mali’s 42.2 t is industrial output on official data reported by MAP; Guinea’s about 72 t is the 2.32 Moz reported by Reuters. Guinea’s 72 t is output; its exports were about 69.6 t. Iceland’s aluminium export share is Statistics Iceland’s (34.5% in 2025); the Atlas HS7601 line gives 28.6% for 2024. Guinea’s bauxite share is the Atlas figure of 85.3%; an Atlas API pull gives 86.1%.
Conflicts reported both ways. Ajaokuta completion: about 90% when work halted in 1996 (2003 US Embassy cable via BusinessDay) against 98% in 1994 (Guardian Nigeria, unsourced); both are shown. Ajaokuta cost: no audited total. The 2003 US Embassy cable quoted by BusinessDay gives the Nigerian government’s estimate of “at least USD 5 billion” and the World Bank’s “about USD 7 billion (not adjusted for inflation)”. The Manufacturers Association of Nigeria’s “over $8 billion”, reported in the same article, is an industry body’s estimate; the body states the range as at least US$5bn to over US$8bn, attributed at each end, consistent with our earlier Ajaokuta note. No primary source (Ministry of Steel, BPE or a Senate report) was found for the US$8bn figure. The US$10bn-plus figure is an arbitration claim by Global Steel, not a cost estimate. Speaker Dogara gave US$5.1bn (c. 2017). Cobalt hydroxide price: US$22 to US$23 a pound on 11 August 2026 (Fastmarkets) against US$14.63 a pound on 23 October 2026 (Fastmarkets via CME, payable 71%); the body uses only the August figure with its source and flags the later quote here. Mozal share of GDP: about 2% (IMF CR 26/45, used) against about 4% (World Bank/CRU, about pp.33 to 35) and about 3% (AIM; South32 CEO). Mozal holding cost: about US$5m a year on a 100% basis (South32, used) against an attributable R25m (~US$1.55m) a month reported by MiningMX, which may include wider holding costs. DRC 2027 cobalt quota: 87,000 t base (ARECOMS via Fastmarkets) against 96,600 t including the strategic quota (Reuters via Reporte Minero); the body uses only the 2026 figure. Zimbabwe suspension timing: 25 February (Reuters, 25 February 2026, used) against 26 February (Reuters, 9 April 2026) and a March suspension and May resumption (Benchmark). Quotas: conditions set by ministry letter of 2 April, first quota reported 14 April (Reuters, used); Bikita reported resuming exports on 14 May (Xinhua). The January 2027 concentrate ban date is stated by Reuters (9 April and 18 June 2026) and by the mines minister in June 2025 (Mining Technology, 11 June 2025); lithium producers asked in June 2026 for an extension to June 2027.
Reported, not confirmed. Guinea’s 150 Mt bauxite cap is reported by trade press only; no decree or arrêté was found, Reuters reported in July that curbs had not been implemented, and trade press reports exports up 21% year to date in October. Guinea’s 3 July 2026 gold decree is numbered D-2026-0212-PRG-SGG by Guinéenews; the number of the 8 July replacement decree was not found, and neither is confirmed against the Journal Officiel. The 19 June announcement date rests on trade press (Agence Ecofin, Financial Afrik); Reuters said only that the ban came “last week” on 29 June. The first refined gold export from the Nimba refinery, reported for 9 October 2026, rests on an aggregator citing the presidency and is not used in the body. Zimbabwe’s reaffirmation of the January 2027 ban on 9 October 2026 is aggregator-sourced and is not used; the 2027 ban has no gazetted instrument, so the body says it is “expected”. The cabinet date for the 2027 ban (reported as 10 June 2025) is not stated in a source in hand and is not used. The Zimbabwe 9M 2026 export data come from MMCZ via SMM; the MMCZ primary release was not found. Guinea’s refinery count (“three under construction”) and 2030 target come from SMM; the three named projects are sourced separately (SPIC: Bloomberg, Alwihda, Mining Weekly; WCAG: Engineering News; Chalco: SSE news). The Mining Weekly report of November 2025 gives a target of five to six refineries and about 7 Mtpa, broadly consistent with SMM. The DRC concentrate arrêté and Gabon’s September 2025 regulatory text have no published numbers. No cobalt refinery under construction in the DRC was identified: Buenassa is at pre-feasibility and Chemaf’s Mutoshi plant has been stalled since 2019, with a union claim of full production by January 2027 unconfirmed by the owner.
Deliberately omitted. No US$10bn figure for Ajaokuta (see Conflicts). No ownership split for Mali’s Sénou refinery (the 62/38 split in the dossier was not found in a source in hand). No ARECOMS decision number for the DRC quota (not in the cited source). No “about six weeks” for Zimbabwe’s reversal. No “phase one” or “official count” for RAFFINOR. No refinery name from Reuters (Reuters does not name the Nimba Gold Refinery; the name comes from trade press). No “98% complete” without the 90% alternative. No Mozal “4% of GDP”, “1% turnover tax”, “US$5m a month” or 320 kt capacity. No Nimba “250 t/yr”. No Indonesian “300 Mt” RKAB. No “90% of nickel profits to China”: the claim traces to a seminar remark with no published method. No retained-versus-repatriated value split for Indonesian nickel, because no published study quantifies one; capacity ownership (about 75% Chinese) is used as the proxy and labelled as such. Barrick’s Mali settlement (US$253m in Barrick’s MD&A; US$430m reported by Bloomberg) is omitted because the two figures cannot be reconciled and the case is not needed for the argument. Niger’s Somaïr nationalisation is omitted because we have not published on uranium. The Venalum revival cost is omitted because it reached us second-hand from Wood Mackenzie. No Wood Mackenzie source was used.
Evidence base. There is no peer-reviewed econometric study of mineral export bans and domestic value added in the four leading journals searched (2015 to 2026). The causal mineral evidence is two working papers (Kee and Xie; Bosker et al.); the best peer-reviewed analogue is on logs (Marchand and Zerbo). The OECD’s fivefold rise in restrictions is driven mainly by export taxes and licensing rather than bans. The scoring in Exhibits 3 and 8 and the deadline forecast in Section V are our judgement.
Primary-source share. Of the 91 documents cited, 49 (54 per cent) are primary, official or academic: legal instruments, regulator notices, company filings and statements, official statistics, multilateral and intergovernmental publications, and peer-reviewed or academic working papers. The remainder are wire services, national and specialist press, think tanks and trade publications. Three trade aggregators (AL Circle, SMM twice) carry figures that are attributed to trade press in the body. Recount after the fact-check: counting the 6 Atlas pages as one dataset and the Kee and Xie slides with their paper, the share is 43 of 85 (51 per cent). Strictly government, regulator, company or multilateral documents, excluding academic work, number 36 of 91 (40 per cent).
Interests. The author led Rio Tinto’s Simandou country strategy team from April 2023 to July 2025 and holds a small long position in Rio Tinto shares. Rio Tinto owns the ISAL smelter in Iceland cited in this article.
Not investment research. This is commentary and analysis. It is not a recommendation and not an inducement to buy, sell or hold any security or commodity.
91 numbered sources
- 1 CRU Strategy (Lazar, I., Pegrum, L., Odling, A., with Shirodkar, M., Ong, R. and Feinberg, C.) for the World Bank EGPS RISE programme, Technical and Economic Feasibility of Smelting and Refining in Developing Countries, June 2026, 122 pp. Multilateral feasibility study. Source for the 500 MW floor (p.6, p.9 and p.12, quoted from p.12), 13 to 15 MWh per tonne (p.6), unit capital cost of new aluminium smelting capacity outside China, “around $2000/t” with Chinese partnership and “at least $3000/t” without, in the text accompanying Figure 103 (p.86 by the list of figures), the lock-in quotation (p.12) and the five pass-fail gates (pp.8 to 9). Page numbers marked “about” are inferred from adjacent page markers. https://egps.worldbank.org/sites/default/files/2026-06/P513669-ec1192fb-8eac-43db-ae73-bfb82401d3ae%20%281%29.pdf
- 2 International Monetary Fund, Republic of Mozambique: 2025 Article IV Consultation, Country Report No. 26/45, Executive Board date 13 February 2026, Staff Report para. 16 (p.8). Primary multilateral document. Source for “a major aluminum producer” at “about 2 percent of GDP and one-fifth of Mozambique’s exports”; the report does not name Mozal. https://www.imf.org/-/media/files/publications/cr/2026/english/1mozea2026001-source-pdf.pdf
- 3 Reuters, “Guinea plans regional gold refining hub as West African race intensifies”, 29 June 2026, via Mining.com. Wire report. Source for the Nimba Gold Refinery’s US$30m public-private partnership and its nameplate of 530 tonnes a year rising to 733 tonnes, and for Guinea’s 2025 gold output of “roughly 2.32 million ounces” (about 72 t). The article does not name the refinery. The 7.4 to 10.2 multiple is our calculation. https://www.mining.com/web/guinea-plans-regional-gold-refining-hub-as-west-african-race-intensifies/
- 4 Harvard Growth Lab, Atlas of Economic Complexity, Country Rankings (HS 2012, 2024 trade data, 146 countries, Atlas v24.4.3), accessed 31 October 2026. Academic statistical dataset. Source for 2024 ECI ranks as published. The 2015 ranks are our derivations from Atlas data (see Technical notes). https://atlas.hks.harvard.edu/rankings
- 5 South32 Limited, “Mozal Aluminium placed on care and maintenance”, RNS announcement, 16 March 2026. Primary company disclosure. Source for care and maintenance from 15 March 2026, the failure to secure “sufficient and affordable power”, the ownership split (South32 63.7%, IDC 32.4%, Government of Mozambique 3.9%) and the holding cost of about US$5m a year on a 100% basis. https://www.investegate.co.uk/announcement/rns/south32-limited-di---s32/mozal-aluminium-placed-on-care-maintenance/9475770
- 6 International Finance Corporation, Project 7764, “Mozambique Aluminum (Mozal)”, project disclosure. Primary multilateral disclosure. Source for IFC signing on 30 June 1998 (approved 19 June 1997) and the estimated cost of US$1.3bn, including contingency, price escalation, initial working capital and construction-period interest. https://disclosures.ifc.org/project-detail/SPI/7764/mozambique-aluminum-mozal
- 7 Agence Ecofin, “Guinea bans raw gold exports, mandates local refining before shipment”, 22 June 2026. Trade press. Source for President Doumbouya’s announcement on 19 June 2026 of the end of raw gold exports and for the Nimba Gold Refinery, under installation in Gbessia, Conakry. Financial Afrik (24 June 2026) also dates the meeting to 19 June 2026. https://www.ecofinagency.com/news-industry/2206-56669-guinea-bans-raw-gold-exports-mandates-local-refining-before-shipment
- 8 Guinéenews, “Exportation de l’or: le président Doumbouya impose le raffinage local obligatoire préalable”, 8 July 2026. National press report of the decree. Source for decree D-2026-0212-PRG-SGG of 3 July 2026, repealed and replaced by a decree signed 8 July 2026, requiring exported gold to be presented as refined, certified bars. Neither decree number is confirmed against the Journal Officiel. https://guineenews.org/2026/07/08/exportation-de-lor-le-president-doumbouya-impose-le-raffinage-local-obligatoire-prealable/?amp=1
- 9 International Energy Agency, Policies Database, “Temporary suspension of cobalt export from the Democratic Republic of Congo”. Intergovernmental policy record. Source for ARECOMS Decision No. 001/ARECOMS/2025 of 22 February 2025 suspending cobalt exports. https://www.iea.org/policies/28969-temporary-suspension-of-cobalt-export-from-the-democratic-republic-of-congo
- 10 Benchmark Mineral Intelligence, “DRC to lift cobalt export ban and impose quotas through 2027”, 22 September 2025. Specialist price-reporting agency. Source for the quota regime from 16 October 2025: an 87,000 tonne base allocation plus a 9,600 tonne strategic quota, 96,600 tonnes for 2026. The ARECOMS decision text was not read. https://source.benchmarkminerals.com/article/drc-to-lift-cobalt-export-ban-and-impose-quotas-through-2027
- 11 Reuters, “Zimbabwe to introduce lithium export quotas, sets conditions for resumption of shipments”, 9 April 2026, via Kitco. Wire report of a ministry letter dated 2 April 2026. Source for quotas to be communicated to each producer “until a January 2027 ban on concentrate shipments comes into force” and for commitments to build lithium sulphate plants before 1 January 2027. Reuters (18 June 2026) again refers to “a January 2027 ban”. https://www.kitco.com/news/off-the-wire/2026-04-09/zimbabwe-introduce-lithium-export-quotas-sets-conditions-resumption
- 12 The Nation (Malawi), “Mining revenue decline 89% on raw export ban”, 5 March 2026. National press report citing the government’s 2026 Annual Economic Report. Source for K70m collected in FY2025/26 against a K665.45m target and the budget’s reference to a “lift” of the ban. https://mwnation.com/mining-revenue-decline-89-on-raw-export-ban/
- 13 African Union, Africa Mining Vision, February 2009. Primary policy document. Cited as the policy origin of the beneficiation push; located but not read in full for this article. https://au.int/sites/default/files/documents/30995-doc-africa_mining_vision_english_1.pdf
- 14 OECD, OECD Inventory of Export Restrictions on Industrial Raw Materials 2025, May 2025. Primary intergovernmental dataset. Source for the more than fivefold rise in restrictions between 2009 and 2023 and the 2023 composition of new measures (export taxes 54%, prohibitions 23%, licensing 22%), shown as data labels in Figure 2.11, “Type of new measures introduced in 2022 and 2023”, p.14 of the report PDF (mirrored at https://apo.org.au/sites/default/files/resource-files/2025-05/apo-nid330634.pdf). https://www.oecd.org/en/publications/oecd-inventory-of-export-restrictions-on-industrial-raw-materials-2025_facc714b-en/full-report/component-2.html
- 15 Kowalski, P. and Legendre, C., “Raw materials critical for the green transition: Production, international trade and export restrictions”, OECD Trade Policy Papers No. 269, 11 April 2023. Intergovernmental research paper covering 2009 to 2020. Source for the “non-trivial role” of restrictions in critical-mineral markets. https://doi.org/10.1787/c6bb598b-en
- 16 OECD, OECD Inventory of Export Restrictions on Critical Raw Materials 2026, 28 April 2026, DOI 10.1787/d5ca8f62-en. Primary intergovernmental dataset. Source for coverage of up to 70% of global cobalt and manganese exports. Counts coverage, not effects. https://www.oecd.org/en/publications/oecd-inventory-of-export-restrictions-on-critical-raw-materials-2026_d5ca8f62-en/full-report/component-3.html
- 17 Fastmarkets, “DRC may reduce cobalt quota if market needs rebalancing, ARECOMS says”, 12 August 2026. Specialist price-reporting agency. Source for cobalt hydroxide at US$22 to US$23 a pound on 11 August 2026, about four times its level of 20 February 2025. https://www.fastmarkets.com/insights/drc-may-reduce-cobalt-quota-if-market-needs-rebalancing-arecoms-says-exclusive/
- 18 VOI, “The Ministry of Energy and Mineral Resources Cuts Nickel Production to 260 Million Tons”, 13 February 2026. Indonesian press quoting Tri Winarno, Director General of Mineral and Coal, ESDM. Source for the 2026 nickel ore RKAB of about 260 Mt, against 379 Mt for 2025. https://voi.id/en/amp/558472
- 19 Kontan, “Revisi RKAB 2026 disetujui, segini kuota produksi batubara dan nikel”, 18 October 2026. Indonesian business press reporting the Directorate General. Source for the revised 2026 RKAB of about 290 Mt. No primary ESDM document for the revised total was found. https://industri.kontan.co.id/news/revisi-rkab-2026-disetujui-segini-kuota-produksi-batubara-dan-nikel
- 20 United Republic of Tanzania, Mining (Minerals and Mineral Concentrates Trading) (Amendment) Regulations, GN No. 539C of 2024, in force 1 July 2024, text via FB Attorneys. Primary legal instrument. Source for the set-aside of not less than 20% of gold for domestic sale as a condition of an export permit. https://fbattorneys.co.tz/wp-content/uploads/2024/10/Mining-Minerals-and-Mineral-Concentrates-Trading-Amendment.pdf
- 21 Ghana Gold Board, “GoldBod orders mandatory local refining of gold doré before export, effective September 1”, 24 August 2026. Primary regulator notice. Source for the directive’s scope: it is addressed to self-financing aggregators and covers doré bought under arrangements with approved offtakers. https://goldbod.gov.gh/news/goldbod-orders-mandatory-local-refining-of-gold-dore-before-export-effective-september-1
- 22 Bacanora Lithium and others v. United Mexican States, ICSID Case No. ARB/24/21, Procedural Order No. 5, 11 December 2025, via italaw. Primary tribunal document. Source for the claimants (Bacanora Lithium Limited and Sonora Lithium Ltd., both UK, and Ganfeng International Trading (Shanghai) Co. Ltd.) and the refusal to suspend the claim. https://www.italaw.com/sites/default/files/case-html-files/italaw180859-Bacanora-Lithium-and-others-v-Mexico-Procedural-Order-No-5-Decision-on-the-Suspension-of-the-Arbitration-due-to-Changed-Circumstances-Dec-11-2025.html
- 23 Presidência da República (Brazil), Lei nº 15.506, de 16 de setembro de 2026. Primary legislation. Source for Brazil’s critical-minerals policy law, sanctioned without vetoes. https://www.planalto.gov.br/ccivil_03/_ato2023-2026/2026/lei/l15506.htm
- 24 Reuters, “China’s Huayou reports first lithium salt exports from Zimbabwe”, 28 April 2026, via Mining.com. Wire report. Source for the US$400m, 50,000 tonne-a-year PLZ Arcadia sulphate plant and its first export in April 2026. https://www.mining.com/web/chinas-huayou-reports-first-lithium-salt-exports-from-zimbabwe/
- 25 Ivanhoe Mines, “Ivanhoe Mines announces first anode production from Kamoa-Kakula copper smelter”, news release, January 2026. Primary company disclosure. Source for first anode on 29 December 2025, 500,000 tonnes a year of capacity and a cost of about US$1.1bn. https://www.newsfilecorp.com/release/279364/Ivanhoe-Mines-Announces-First-Anode-Production-from-KamoaKakula-Copper-Smelter
- 26 Reuters, “Congo bans copper and cobalt concentrates exports, official order says”, 6 August 2026, via Kitco. Wire report of an inter-ministerial arrêté signed 29 June 2026. Source for the ban with immediate effect and the provision that one-year waivers may be granted “under strategic circumstances”. The arrêté number was not found. https://www.kitco.com/news/off-the-wire/2026-08-06/congo-bans-copper-and-cobalt-concentrates-exports-official-order-says
- 27 Ivanhoe Mines, “Response to Reuters article”, 6 August 2026. Primary company statement, an interested party. Source for Ivanhoe’s statement that a ban on unbeneficiated concentrate exports “has been in place and enforced in the DRC for close to 10 years”. https://www.ivanhoemines.com/wp-content/uploads/20260806-Response-to-Reuters-Article-vF.pdf
- 28 Freeport-McMoRan Inc., Form 10-Q for the quarter ended 30 June 2026. Primary regulatory filing. Source for the expiry of PT-FI’s concentrate export permit on 16 September 2025 without renewal, PT-FI’s cessation of concentrate sales and the history of export relaxations under the 2023 ban. https://www.sec.gov/Archives/edgar/data/0000831259/000083125926000036/fcx-20260630.htm
- 29 Freeport-McMoRan Inc., Third-Quarter 2026 results, Exhibit 99.1, 27 October 2026. Primary regulatory filing. Source for the Manyar smelter re-commencing operations in late August 2026. https://www.sec.gov/Archives/edgar/data/0000831259/000083125926000045/a3q2026exhibit991.htm
- 30 Reuters, “Guinea first-half bauxite exports hit record high on Chinese demand”, 22 July 2026, via Mining.com. Wire report citing ministry data. Source for H1 2026 exports of 114.8 Mt against 99.8 Mt a year earlier, and for the export curbs not having been implemented. https://www.mining.com/web/guinea-first-half-bauxite-exports-hit-record-high-on-chinese-demand/
- 31 AL Circle, “Bauxite flows face a Q4 slowdown as Guinea’s 150Mt export cap tightens supply”, 22 October 2026. Trade aggregator; no instrument cited. Source only for the reported 150 Mt cap, which this article treats as a reported plan. https://www.alcircle.com/news/bauxite-flows-face-a-q4-slowdown-as-guineas-150mt-export-cap-tightens-supply-121644
- 32 Reuters, “Guinea revokes Emirates Global Aluminium concession, transfers assets to new local firm”, 6 August 2025, via TimesLive. Wire report. Source for the revocation decree, announced in early August 2025, citing GAC’s failure to comply with rules requiring refinery-construction plans, and the transfer to Nimba Mining SA. https://www.timeslive.co.za/news/africa/2025-08-06-guinea-revokes-emirates-global-aluminium-concession-transfers-assets-to-new-local-firm/
- 33 The National, “EGA settles disputes with Guinea over bauxite mine project”, 6 May 2026. National press. Source for the termination of GAC’s agreement in 2025, EGA’s US$765m charge and the settlement announced on 6 May 2026. https://www.thenationalnews.com/business/2026/05/06/ega-settles-disputes-with-guinea-over-bauxite-mine-project/
- 34 SMM (Shanghai Metals Market), “Guinea aims for 5 alumina refineries, 7-8m mt/year capacity by 2030 under Simandou 2040 strategy”, 14 October 2026. Trade aggregator. Source for the target of five refineries and 7 to 8 Mtpa by 2030 and for three refinery projects under construction, as stated by a ministry adviser. It does not name the projects or give capacities; those are sourced separately. Used with an attribution in the text. https://news.metal.com/newscontent/104160454-guinea-aims-for-5-alumina-refineries-7-8m-mtyear-capacity-by-2030-under-simandou-2040-strategy
- 35 Alwihda Info, “Guinée: le Premier ministre fait le point sur le projet de raffinerie d’alumine de Boffa avec SPIC”, 19 August 2026. Regional press. Source for the Prime Minister’s progress review, the 1.2 Mtpa refinery at Boffa and its official launch on 26 March 2025; no completion percentage or megawatt figure was given. https://www.alwihdainfo.com/guinee-le-premier-ministre-fait-le-point-sur-le-projet-de-raffinerie-dalumine-de-boffa-avec-spic/
- 36 Engineering News (Creamer Media), “Guinea launches construction of $1.2bn WCAG alumina refinery”, 15 December 2025. Specialist press. Source for Winning Consortium Alumina Guinea’s 1.2 Mtpa refinery at Dobali, Boké prefecture, investment of more than US$1.2bn and the launch of construction. Date from the article URL. https://www.engineeringnews.co.za/article/guinea-launches-construction-of-12bn-wcag-alumina-refinery-2025-12-15
- 37 Shanghai Stock Exchange news (Yicai), “Chalco to invest about USD1 billion in alumina plant in Guinea”, 25 May 2026. Exchange news service reporting a listed company’s announcement of 22 May 2026. Source for Chalco’s 1.2 Mtpa alumina plant linked to its Boffa bauxite project and investment of about US$1bn. https://english.sse.com.cn/news/newsrelease/voice/c/c_20260525_10819573.shtml
- 38 Bloomberg News, “Chinese firm to build Guinea’s biggest alumina processing plant”, 2 January 2025, via Mining.com. Wire report. Source for SPIC’s 1.2 Mtpa refinery, its 250 MW power plant (100 MW to the national grid), completion due by the end of 2027 and a December 2028 deadline for commercial production. https://www.mining.com/web/chinese-firm-to-build-guineas-biggest-alumina-processing-plant/
- 39 Mining Weekly (Creamer Media), “Guinea to fast-track alumina, iron ore processing, mines minister says”, 11 November 2025. Specialist press quoting Mines Minister Bouna Sylla. Source for the SPIC refinery under construction with completion due by end-2027, and for talks with Chinalco on further plants. Date from the article URL. https://www.miningweekly.com/article/guinea-to-fast-track-alumina-iron-ore-processing-mines-minister-says-2025-11-11
- 40 US Geological Survey, Mineral Commodity Summaries 2026: Aluminum. Official statistical series. Source for Iceland at about 750 kt (2025e) and Norway at 1.3 Mt. https://pubs.usgs.gov/periodicals/mcs2026/mcs2026-aluminum.pdf
- 41 Landsvirkjun, Consolidated Financial Statements 2025. Primary audited filing of the state generator. Source for the average price to industrial users of US$31.1/MWh in 2025, excluding transmission. Per-smelter prices are not disclosed. https://ml-eu.globenewswire.com/Resource/Download/5edca2ba-2338-441e-af1a-7aada3d8a086
- 42 OCP Group, Sustainability Report 2024, August 2025. Primary company report. Source for 80% of electricity needs met by clean energy (cogeneration and wind) in 2024. https://ocpsiteprodsa.blob.core.windows.net/media/2025-08/OCP_Sustainbility_Report_2024__2.pdf
- 43 POSCO Newsroom, “On National Steel Day 2019, POSCO Renews Company’s Commitments”, 11 June 2019. Primary company publication. Source for the first molten iron from the Pohang No. 1 blast furnace in the early morning of 9 June 1973. https://newsroom.posco.com/en/on-national-steel-day-2019-posco/
- 44 The Korea Times, “Men of steel: the founding history of POSCO”, 6 February 2011. National press history. Source for Japan’s lending of about 75% of the required capital and the World Bank’s refusal to lend. https://www.koreatimes.co.kr/southkorea/20110206/men-of-steel-the-founding-history-of-posco
- 45 World Bank, The East Asian Miracle: Economic Growth and Public Policy, Oxford University Press, 1993. Multilateral study. Cited as the standard reference for the developmental-state counter-case. https://documents1.worldbank.org/curated/pt/975081468244550798/pdf/multi-page.pdf
- 46 S&P Global Commodity Insights, “Infographic: Indonesia’s shifting policies drive market volatility”, 13 August 2026. Specialist commodity publisher. Source for Indonesia’s 66.6% share of world nickel mine output in 2025. https://www.spglobal.com/energy/en/news-research/latest-news/metals/081326-infographic-indonesias-shifting-policies-drive-market-volatility
- 47 C4ADS, “Refining Power”, 4 February 2025. Independent research body. Source for Chinese companies or shareholders “ultimately” controlling at least 75% of Indonesia’s nickel refining capacity, on 2023 capacity data. Measures capacity ownership, not a split of value. https://c4ads.org/commentary/refining-power/
- 48 BusinessDay (Nigeria), “Hobbled by corruption, Ajaokuta Steel Mill’s future uncertain”, 19 September 2022. National business press quoting a 2003 US Embassy cable. Source for construction beginning in 1979, about 90% completion when work halted in 1996, the absence of blast-furnace steel, and the cost estimates: the Nigerian government’s “at least USD 5 billion” and the World Bank’s “about USD 7 billion (not adjusted for inflation)” from the cable, and the Manufacturers Association of Nigeria’s “over $8 billion”. https://businessday.ng/business-economy/article/hobbled-by-corruption-ajaokuta-steel-mills-future-uncertain/
- 49 The Guardian (Nigeria), “Ajaokuta steel plant, like refineries, a story retold, promises unkept”, 13 January 2023. National press, unsourced on this point. Source for the alternative account of 98% completion in 1994; shown alongside the 90% figure, not alone. https://guardian.ng/business-services/ajaokuta-steel-plant-like-refineries-a-story-retold-promises-unkept/
- 50 Ternium S.A., Annual Report on Form 20-F for fiscal year 2010. Primary regulatory filing. Source for the nationalisation of Sidor (Decree Law 6058 of 30 April 2008; transfer on 7 May 2009) and compensation of US$1.97bn. https://www.sec.gov/Archives/edgar/data/0001342874/000095012311063338/c19279e20vf.htm
- 51 SteelOrbis, “Full year crude steel output at Venezuela’s Sidor reaches lowest level since 2007”, 24 January 2017. Specialist steel press. Source for Sidor’s peak output of 4.30 million t of crude steel in 2007. https://www.steelorbis.com/steel-news/latest-news/full-year-crude-steel-output-at-venezuelas-sidor-reaches-lowest-level-since-2007-968756.htm
- 52 SteelOrbis, “Venezuela’s Sidor reports no steel production in 2019 so far”, 17 June 2019. Specialist steel press. Source for no steel output from January to May 2019 (and about 80,000 t in 2018). https://www.steelorbis.com/steel-news/latest-news/venezuelas-sidor-reports-no-steel-production-in-2019-so-far-1098847.htm
- 53 Reuters, “Glencore’s South African smelter cancels planned job cuts after electricity deal”, 1 June 2026, via LSE.co.uk. Wire report. Source for “Only 11 of the country’s 66 smelters are still operational”, in an article on the ferrochrome industry. https://www.lse.co.uk/news/glencores-south-african-smelter-cancels-planned-job-cuts-after-electricity-deal-md55u4dvalgx5dr.html
- 54 Lamby, L. and Hausmann, R., “Bolivia’s Economic Pivot: Unlocking the Mining and Lithium Potential”, Growth Lab Working Paper No. 264, Harvard Kennedy School, April 2026. Academic working paper. Source for YLB output of 2,462 t in 2025 against 15,000 t capacity (p.21) and Chile at about 298,000 t LCE (p.20). https://growthlab.hks.harvard.edu/wp-content/uploads/2026/05/2026-04-glwp-264-bolivia-economic-pivot-mining-english.pdf
- 55 Sociedad Química y Minera de Chile (SQM), Annual Report on Form 20-F for fiscal year 2025. Primary regulatory filing. Source for NovaAndino Litio SpA (“Codelco holds one share more than 50% of the outstanding shares”) and SQM’s control of management in the first term, 2025 to 2030. https://www.sec.gov/Archives/edgar/data/0000909037/000090903726000023/sqm-20251231.htm
- 56 Bosker, M., van den Herik, E.-M., Pelzl, P. and Poelhekke, S., “The (Un)intended Consequences of Export Restrictions: Evidence from Indonesia”, CEPR Discussion Paper No. 20791, 2025. Academic working paper, not peer-reviewed. Source for the nickel-versus-bauxite contrast. https://ideas.repec.org/p/cpr/ceprdp/20791.html
- 57 US Geological Survey, Mineral Commodity Summaries 2025: Bauxite and Alumina. Official statistical series. Source for the earlier estimate of 32 Mt for Indonesia in 2024. https://pubs.usgs.gov/periodicals/mcs2025/mcs2025-bauxite-alumina.pdf
- 58 US Geological Survey, Mineral Commodity Summaries 2026: Bauxite and Alumina. Official statistical series. Source for Indonesian bauxite output of 9.9 Mt (2024, revised) and 10 Mt (2025e), and Guinean alumina output of 351 kt (2024) and 360 kt (2025e). https://pubs.usgs.gov/periodicals/mcs2026/mcs2026-bauxite-alumina.pdf
- 59 Simmons, B. and Marcilly, J., “Resource Nationalism and Downstreaming: Lessons for African Producers of Critical Minerals from Indonesia”, Atlantic Council Africa Center, December 2024. Think-tank report. Source for bauxite export revenue of US$1.3bn (2013) and US$46m (2014) and tax holidays of 5 to 20 years. https://www.atlanticcouncil.org/wp-content/uploads/2024/12/Resource-nationalism-and-downstreaming.pdf
- 60 Australian Government, Department of Industry, Science and Resources, Resources and Energy Quarterly, September 2026. Official statistics. Source for 944 Mt of iron ore exports in 2025-26. https://www.industry.gov.au/sites/default/files/2026-10/resources-and-energy-quarterly-september-2026.pdf
- 61 Coase, R. H., “The Nature of the Firm”, Economica, New Series, 4(16), November 1937, pp. 386 to 405. Peer-reviewed. Origin of the make-or-buy framing. Ricardo’s comparative advantage is cited in the text from D. Ricardo, On the Principles of Political Economy and Taxation, John Murray, London, 1817, chapter 7, a standard bibliographic reference without a URL. https://www.cambridge.org/core/books/economic-nature-of-the-firm/nature-of-the-firm/FF19EEB012CA211AB92FCDBB9ACC9F9D
- 62 Williamson, O. E., The Economic Institutions of Capitalism, Free Press, 1985 (and Markets and Hierarchies, 1975), record via CASBS Stanford. Academic monograph. Source for asset specificity and hold-up. https://casbs.stanford.edu/economic-institutions-capitalism-firms-markets-relational-contracting
- 63 Krueger, A. O. and Tuncer, B., “An Empirical Test of the Infant Industry Argument”, American Economic Review 72(5), December 1982, pp. 1142 to 1152. Peer-reviewed. The NBER working-paper version (w0532, 1980) states the finding: “little basis, at least with regard to Turkish experience, to the notion that non-traditional industries are in some sense more ‘dynamic’ than traditional industries”, from 91 firms. Not generalised to minerals. https://www.jstor.org/stable/1812029
- 64 Harvard Growth Lab, Atlas of Economic Complexity, Guinea export basket, 2024. Academic statistical dataset. Source for bauxite at 85.3% of Guinea’s 2024 goods exports. https://atlas.hks.harvard.edu/countries/324/export-basket
- 65 Mysteel, “GACC: China’s bauxite imports jump 26% YoY in 2025”, 22 January 2026. Trade press reporting China customs (GACC) data. Source for 2025 imports of 200.5 Mt, 149 Mt from Guinea and Guinea’s 74.3% share. https://www.mysteel.net/news/5110991-gacc-chinas-bauxite-imports-jump-26-yoy-in-2025
- 66 Harvard Growth Lab, Atlas of Economic Complexity, Iceland imports, 2024. Academic statistical dataset. Source for Iceland’s 2024 imports of aluminium oxide (HS 2818) of US$676.6m, from an Atlas API pull on 31 October 2026. https://atlas.hks.harvard.edu/explore/treemap?importer=country-352&year=2024
- 67 Statistics Iceland, “Trade in goods 2025”. National statistics office. Source for aluminium at 34.5% of Iceland’s 2025 goods exports. https://statice.is/publications/news-archive/external-trade/trade-in-goods-2025/
- 68 AFP, “Top gold producer Burkina Faso opens first refinery”, 29 September 2026, via EWN. Wire report. Source for the inauguration on Monday 28 September 2026, the cost of CFA 11bn (US$19m), annual capacity of 164 t rising to a projected long-term 515 t, and national output of “more than 94 tonnes” in 2025 according to the World Gold Council. https://www.ewn.co.za/2026/09/29/top-gold-producer-burkina-faso-opens-first-refinery
- 69 Reuters, “Mali starts construction of Russia-backed gold refinery”, 17 June 2025, via Mining.com. Wire report. Source for the “200-ton capacity” refinery at Sénou, Mali’s “controlling stake”, its comparison with nearly four times Mali’s annual gold production, and the June 2025 construction start. The article gives no time basis for the capacity and no ownership percentages. No 2026 progress report was found. https://www.mining.com/web/mali-starts-construction-of-russia-backed-gold-refinery
- 70 Le360 Afrique, citing MAP, “Mali: la production industrielle d’or bondit de plus de 30% au premier semestre 2026”, 25 October 2026. Regional press. Source for Mali’s industrial gold output of 42.2 t in 2025, “selon les données officielles”. https://afrique.le360.ma/economie/mali-la-production-industrielle-dor-bondit-de-plus-de-30-au-premier-semestre-2026_BQJYNF3D5RD33MDBK7NUHQABYE/
- 71 The Citizen (Tanzania), “Stamico flags raw material shortage at Mwanza gold refinery”, 6 January 2026. National press quoting the state miner. Source for 2.995 t bought in 2025, 480 kg a day nameplate and the feed shortage. Utilisation is our calculation. https://thecitizen.co.tz/tanzania/news/national/stamico-flags-raw-material-shortage-at-mwanza-gold-refinery-5317626
- 72 Agence Ecofin, “Why West African gold refineries still depend on a London institution”, 6 July 2026. Trade press. Source for Rand Refinery as the only African refiner on the LBMA Good Delivery List. https://www.ecofinagency.com/news-industry/0607-57083-why-west-african-gold-refineries-still-depend-on-a-london-institution
- 73 Harvard Growth Lab, Atlas of Economic Complexity, Democratic Republic of the Congo country profile. Academic statistical dataset. Source for refined copper at 65.9% of 2024 goods exports. https://atlas.hks.harvard.edu/countries/180
- 74 World Bank, World Development Indicators, GDP per capita (constant 2015 US$), NY.GDP.PCAP.KD, dataset updated 8 October 2026, pulled 31 October 2026. Official statistical series. Source for the GDP per capita levels; percentage changes are our arithmetic. 2025 values are World Bank estimates. https://data.worldbank.org/indicator/NY.GDP.PCAP.KD
- 75 Harvard Growth Lab, Atlas of Economic Complexity, Mozambique export treemap, 2024. Academic statistical dataset. Source for aluminium at 65.1% of goods exports (2005) and 10.3% (2024). https://atlas.hks.harvard.edu/explore/treemap?exporter=country-508&year=2024
- 76 Harvard Growth Lab, Atlas of Economic Complexity, Indonesia export treemap, 2024. Academic statistical dataset. Source for the HS 2604, HS72 and HS75 lines summed by us (US$3.84bn, US$2.29bn and US$31.83bn). https://atlas.hks.harvard.edu/explore/treemap?exporter=country-360&year=2024
- 77 Andrenelli, A., Kowalski, P., Legendre, C., Garsous, G., Frysalaki, E. and Alan-Lee, N., “Trade and domestic effects of export restrictions: Insights from case studies of cobalt, lithium and nickel”, OECD Trade Policy Papers No. 300, 17 December 2025. Intergovernmental case studies, not a panel. Source for both quotations on Indonesian nickel. https://doi.org/10.1787/502e3bcf-en
- 78 Kee, H. L. and Xie, E., “Nickel, Steel and Cars: Export Ban and Domestic Value-Added in Indonesia”, World Bank Policy Research Working Paper No. 11249, 10 November 2025. Multilateral working paper, not peer-reviewed. Source for higher downstream value-added share, more entrants, smaller firms and efficiency losses. https://econpapers.repec.org/RePEc:wbk:wbrwps:11249
- 79 Kee, H. L. and Xie, E., presentation slides, “Indonesia export ban: nickel”, World Bank, 2025. Authors’ presentation. Source for the 5.6% rise in DVAR in 2022 relative to 2011, the 19.7% export share of iron- and steel-using industries, and 5.6% x 19.7% = 1.1% of total export DVAR, “contrasting with the overall decline for the economy”. https://thedocs.worldbank.org/en/doc/6c4802573b0952b66e1106612422f12a-0050012025/related/4A-SlidesIndonesiaExportBanNickel.pdf
- 80 Asyono, A. H., Samputra, P. L. and Djatmiko, H., “Domestic Structural Transformation in a Critical Mineral Economy”, Economies 14(4): 133, 2026. Peer-reviewed, descriptive input-output analysis. Source for nickel forward-linkage breadth of 16 sectors (2010), 8 (2016) and 4 (2020), Table 1. https://doi.org/10.3390/economies14040133
- 81 Azhari, H. and Adrison, V., “The unintended consequence of Indonesia’s mineral export ban”, Mineral Economics, online 23 March 2026. Peer-reviewed. Source for under-reporting or reclassification of 3.45% to 14.75% of import volumes. https://doi.org/10.1007/s13563-026-00618-x
- 82 Guberman, D., Schreiber, S. and Perry, A., “Export Restrictions on Minerals and Metals: Indonesia’s Export Ban of Nickel”, USITC Working Paper ICA-104, February 2024. US government staff paper. Source for 2022 average export unit values (Table 3): about US$60 a tonne for Indonesian ore, and US$25,053 a tonne for unwrought nickel, a global average given for reference because Indonesia does not produce it. https://www.usitc.gov/publications/332/working_papers/ermm_indonesia_export_ban_of_nickel.pdf
- 83 Marchand, S. and Zerbo, M., “Revisiting the Trade Restrictions-Industrialization Nexus in Developing Countries: The Case of Log Export Ban and Wood Processing”, Journal of Forest Economics 38(2): 195 to 233, 2023. Peer-reviewed, 86 countries. Source for the sawnwood and veneer results; forestry, used as an analogue. https://doi.org/10.1561/112.00000562
- 84 Chen, W. et al., “Digging for Opportunity: Harnessing Sub-Saharan Africa’s Wealth in Critical Minerals”, IMF, 29 April 2024. Multilateral analytical note. Source for the quotation that export bans “can backfire and cause production to fall”. https://www.imf.org/en/News/Articles/2024/04/29/cf-harnessing-sub-saharan-africas-critical-mineral-wealth
- 85 SMM, “Zimbabwe’s lithium product exports top US$2.159 billion in first three quarters of 2026”, October 2026, citing Minerals Marketing Corporation of Zimbabwe data. Trade aggregator; the MMCZ primary release was not found. Source for lithium sulphate exports of US$191m within US$2.159bn. The 8.8% share is our calculation. https://news.metal.com/newscontent/104152904-smm-analysis-zimbabwes-lithium-product-exports-top-us2159-billion-in-first-three-quarters-of-2026
- 86 Eramet, “Eramet’s response to the Gabonese government’s announcement on crude manganese export ban starting in 2029”, 2 June 2025. Primary company statement, an interested party. Source for the ban from 1 January 2029. https://www.eramet.com/en/news/eramets-response-to-the-gabonese-governments-an-nouncement-on-crude-manganese-export-ban-starting-in-2029/
- 87 EcoMatin, “Gabon: Eramet promet de transformer 700 000 tonnes de manganèse par an d’ici 2031”, 21 July 2026. Regional business press. Source for the 700 kt protocol and the 7.1 Mt of manganese ore Eramet extracted in Gabon in 2025 (“le groupe a extrait 7,1 millions de tonnes”). The 9.9% share is our calculation. https://ecomatin.net/gabon-eramet-promet-de-transformer-700-000-tonnes-de-manganese-par-an-dici-2031
- 88 Fastmarkets, “KCM seeks new Zambian export duty waiver for hard-to-smelt copper concentrate”, 8 October 2026. Specialist price-reporting agency. Source for the duty being first suspended in August 2025, “while major smelters underwent extended maintenance”, and the suspension ending on 30 September 2026. https://www.fastmarkets.com/insights/kcm-seeks-new-zambian-export-duty-waiver-for-hard-to-smelt-copper-concentrate/
- 89 Reuters, “Zimbabwe bans exports of all raw minerals and lithium concentrates”, 25 February 2026, via Mining.com. Wire report. Source for the suspension of all raw mineral and lithium concentrate exports with immediate effect on 25 February 2026. No statutory instrument for the 2026 suspension or the 2027 ban was found. https://www.mining.com/web/zimbabwe-bans-exports-of-all-raw-minerals-and-lithium-concentrates
- 90 Reuters, “China’s Yahua Industrial Group gets lithium export quota from Zimbabwe”, 14 April 2026, via Kitco. Wire report. Source for a six-month lithium concentrate export quota reported on 14 April 2026. https://www.kitco.com/news/off-the-wire/2026-04-14/chinas-yahua-industrial-group-gets-lithium-export-quota-zimbabwe
- 91 MiningMX, “Merafe’s new power tariff not a silver bullet, warns Glencore”, 11 August 2026. Specialist mining press. Source for the Glencore-Merafe venture’s negotiated tariff of 62c/kWh, down from the interim 87.74c/kWh approved by Nersa in February 2026. https://miningmx.com/news/ferrous-metals/2026-08-11-merafe-s-new-power-tariff-not-a-silver-bullet-warns-glencore/
Images and film. Section photographs are from Wikimedia Commons under the licences named in each caption, graded and where stated cropped by ZMK Advisory. Exhibits 1 to 8 are built by ZMK Advisory from the sources named on each exhibit. The film The True Cost of Building It Yourself was produced by ZMK Advisory in July 2026 and reflects the record at that date.
Every Field Note goes live on this site first, then on LinkedIn and X.
Follow ZMK Advisory to see the next one on the day it publishes.